Fig. 1
Download original image
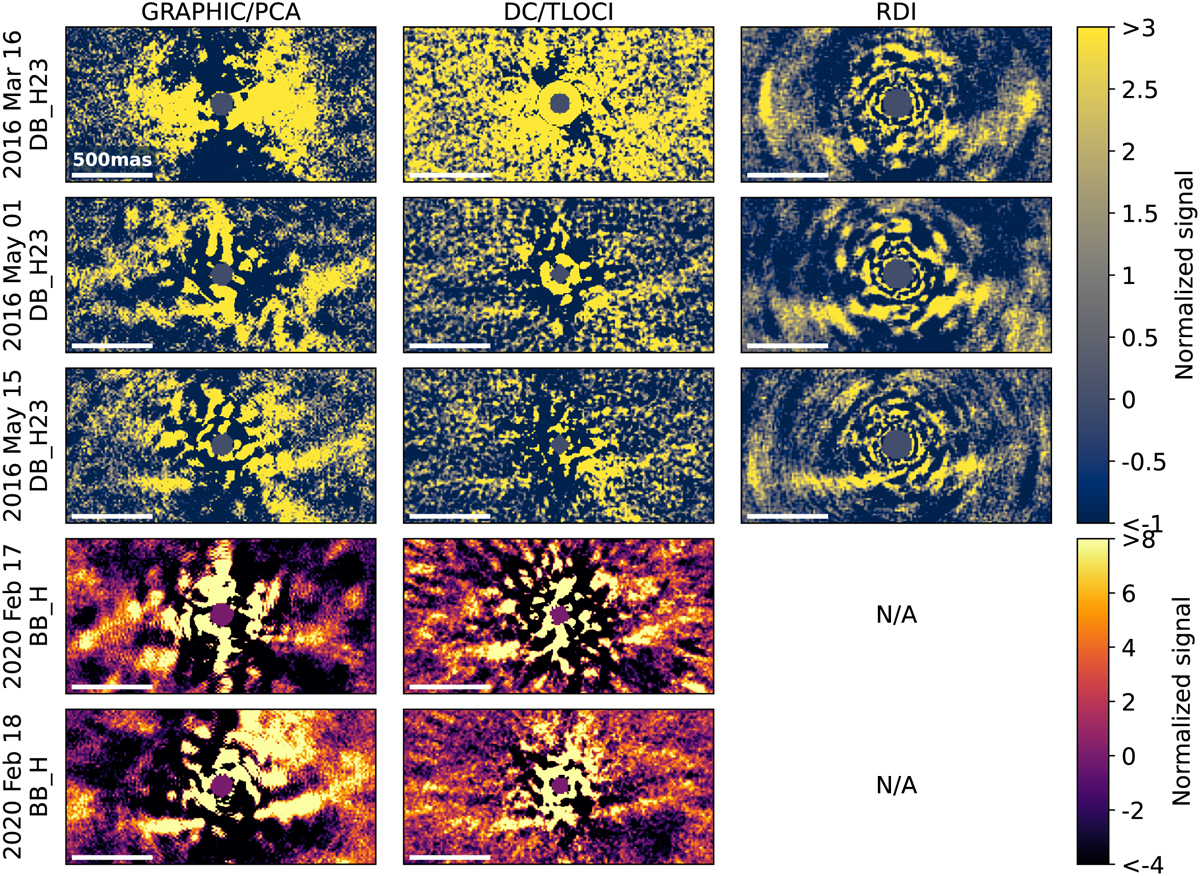
SPHERE/IRDIS images of the HD 112810 debris disk. Each column indicates data processed via a different method: GRAPHIC/PCA (Sect. 4.1; Hagelberg et al. 2016), TLOCI as provided by the SPHERE data center (Sect. 4.2; Delorme et al. 2017) or RDI (Sect. 4.3; Xie et al. 2022); rows indicate each observation epoch. In each case, the two SPHERE/IRDIS channels are co-added. There are no RDI reductions for the BB_H data, since there is far more data collected with the DB_H23 filter in the archive, and the reference library we considered does not collate BB_H data (Xie et al. 2022). The “normalized signal” is calculated relative to the background noise in the wide-field; we note that this is not a true S/N at very small separations, where the noise is higher than the background limit.
Current usage metrics show cumulative count of Article Views (full-text article views including HTML views, PDF and ePub downloads, according to the available data) and Abstracts Views on Vision4Press platform.
Data correspond to usage on the plateform after 2015. The current usage metrics is available 48-96 hours after online publication and is updated daily on week days.
Initial download of the metrics may take a while.