Fig. 5
Download original image
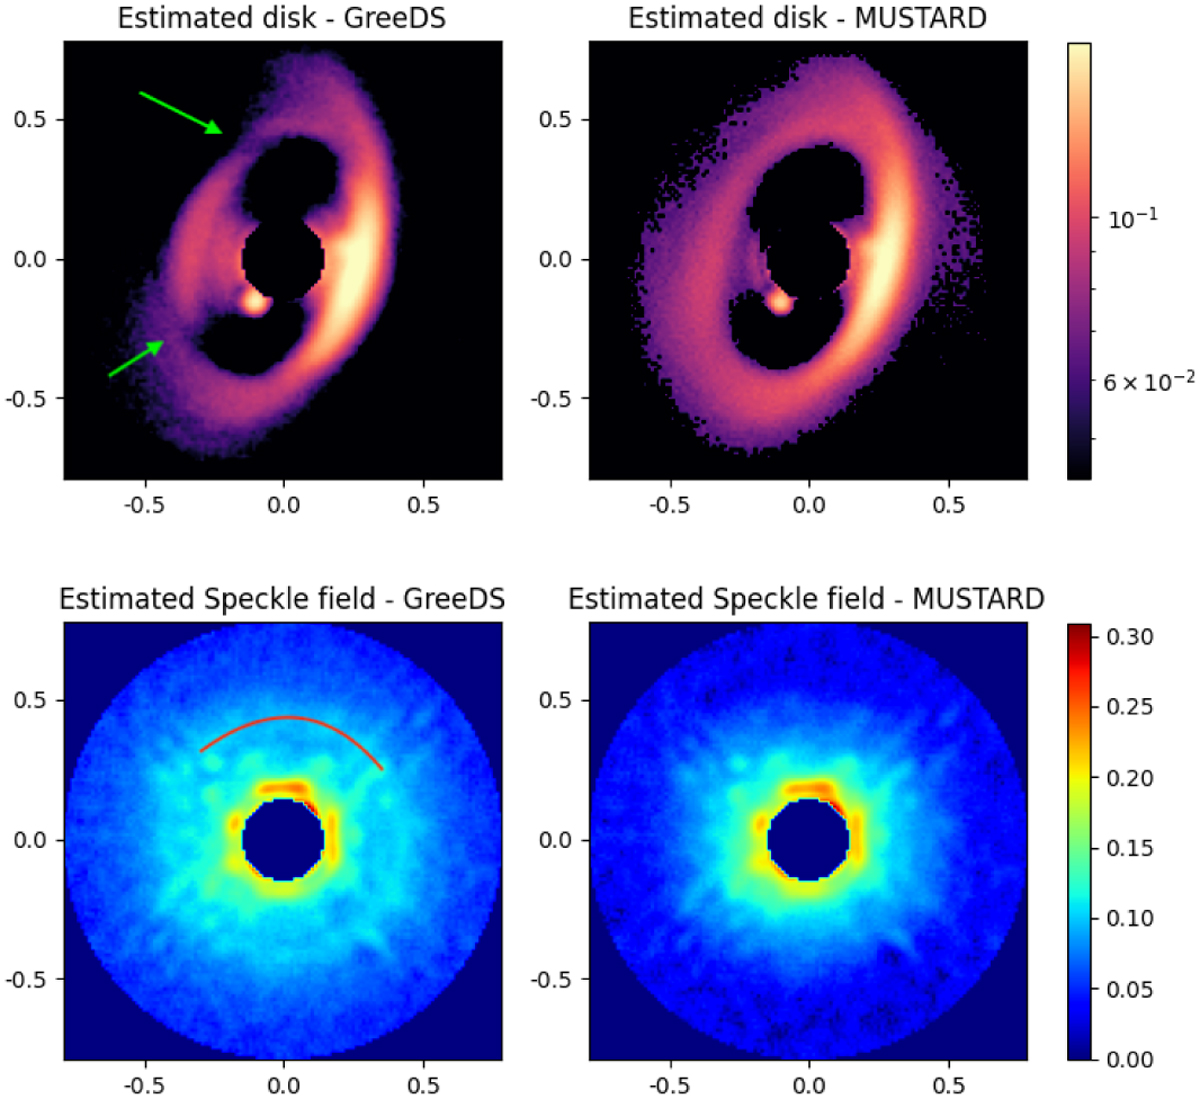
Images of a VLT/SPHERE/IRDIS K1 data set on PDS 70 obtained using I-PCA (left) and mustard (right). The top row displays the estimated circumstellar signal, while the bottom row shows the mean estimated speckle field. The color scale is arbitrary (yet consistent between all plots in relative terms) and displayed in a logarithmic scale. The green arrows indicate the location of shadows in the disk, which are the consequences of the lack of circular component in the disk, and are consistent with the location of a bright arc (highlighted in red) in the speckle field estimation.
Current usage metrics show cumulative count of Article Views (full-text article views including HTML views, PDF and ePub downloads, according to the available data) and Abstracts Views on Vision4Press platform.
Data correspond to usage on the plateform after 2015. The current usage metrics is available 48-96 hours after online publication and is updated daily on week days.
Initial download of the metrics may take a while.