Fig. 4
Download original image
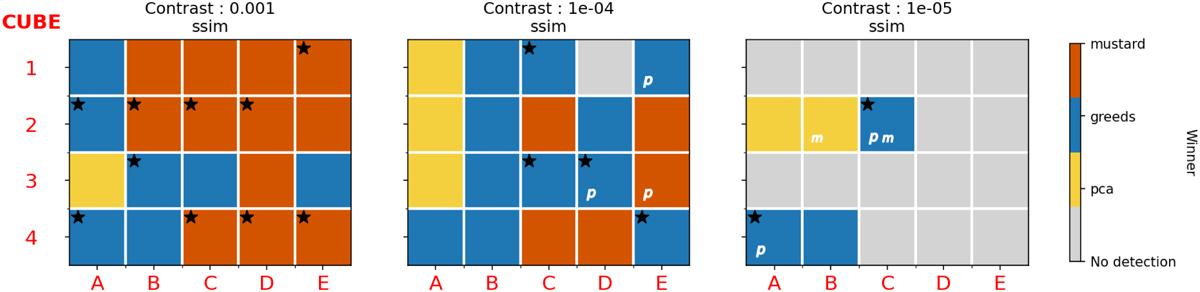
Results of our systematic tests to compare PCA, I-PCA (GreeDS), and mustard. Each cell represents a different synthetic data set, and its color indicates which algorithm performed best according to the SSIM metric. The five disk morphologies are labeled along the x-axis (see Fig. 3 for details), the four empty data sets used for injection along the y-axis (see Table 2 for details), and the three contrast levels in the left (10−3), middle (10−4), and right (10−5) plots. White letters on a cell indicate which algorithm(s) did not detect the disk (p stands for PCA, g for I-PCA, and m for MUSTARD). Gray cells mean that no algorithm detected the disk. Black stars indicate that all five metrics (SSIM, Spearman, Pearson, Euclidean, and SAD) selected the same winner.
Current usage metrics show cumulative count of Article Views (full-text article views including HTML views, PDF and ePub downloads, according to the available data) and Abstracts Views on Vision4Press platform.
Data correspond to usage on the plateform after 2015. The current usage metrics is available 48-96 hours after online publication and is updated daily on week days.
Initial download of the metrics may take a while.