Fig. 3
Download original image
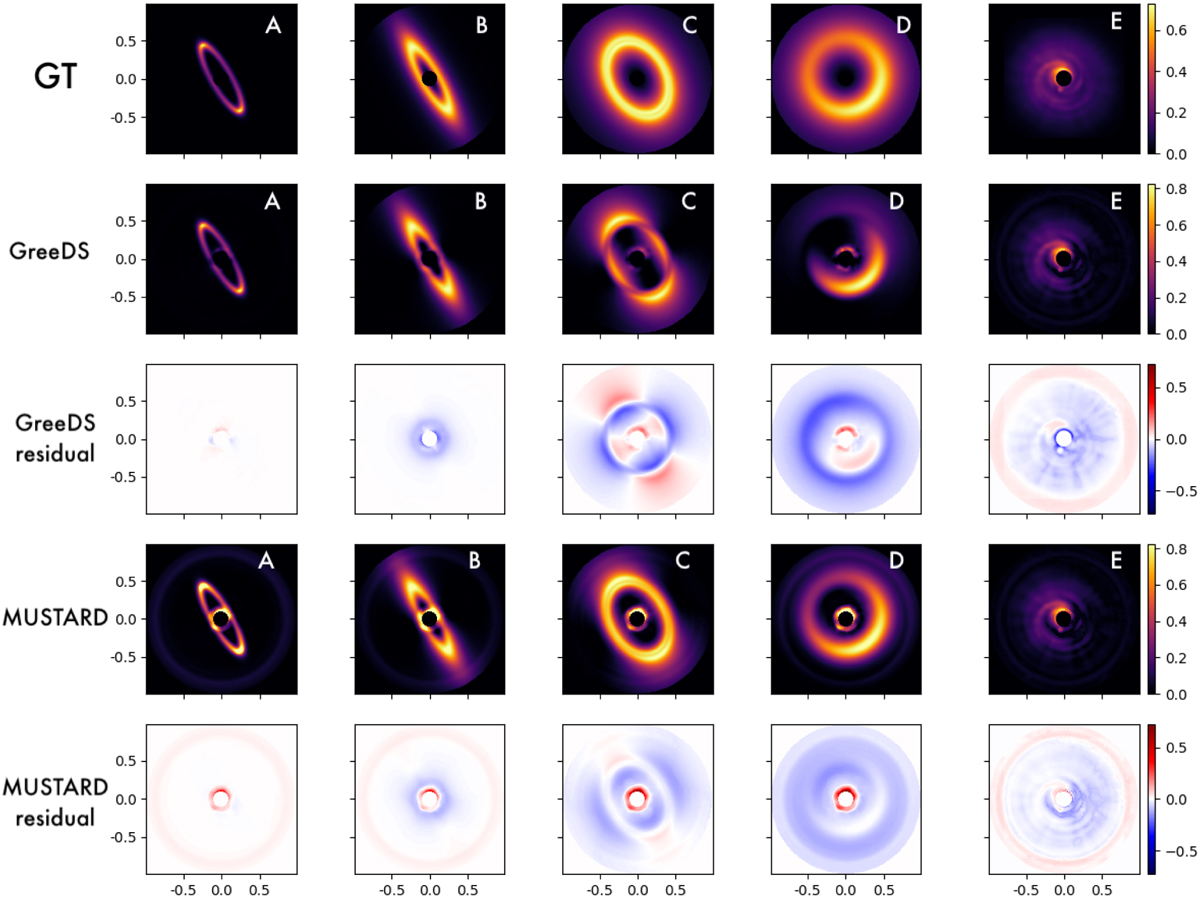
Disk estimations for a contrast of 10−3 injected in the ADI cube no. 4 (see Table 2). Top: GT (injected disk images). Second and third rows: I-PCA estimation using GreeDS implementation and its residuals. Last two rows: mustard estimation and its residuals. In the residual maps, we emphasize the missing disk signal in blue, and excess signal in red. To highlight morphological biases only (i.e., not absolute flux recovery), disk estimations were rescaled in flux before the computation of the difference with the ground truth (GT) to obtain the residuals. The rescaling factors correspond to the flux ratio in a FHWM aperture located at the brightest pixel in the disk GT. Axis ticks are in arcseconds.
Current usage metrics show cumulative count of Article Views (full-text article views including HTML views, PDF and ePub downloads, according to the available data) and Abstracts Views on Vision4Press platform.
Data correspond to usage on the plateform after 2015. The current usage metrics is available 48-96 hours after online publication and is updated daily on week days.
Initial download of the metrics may take a while.