Fig. 2
Download original image
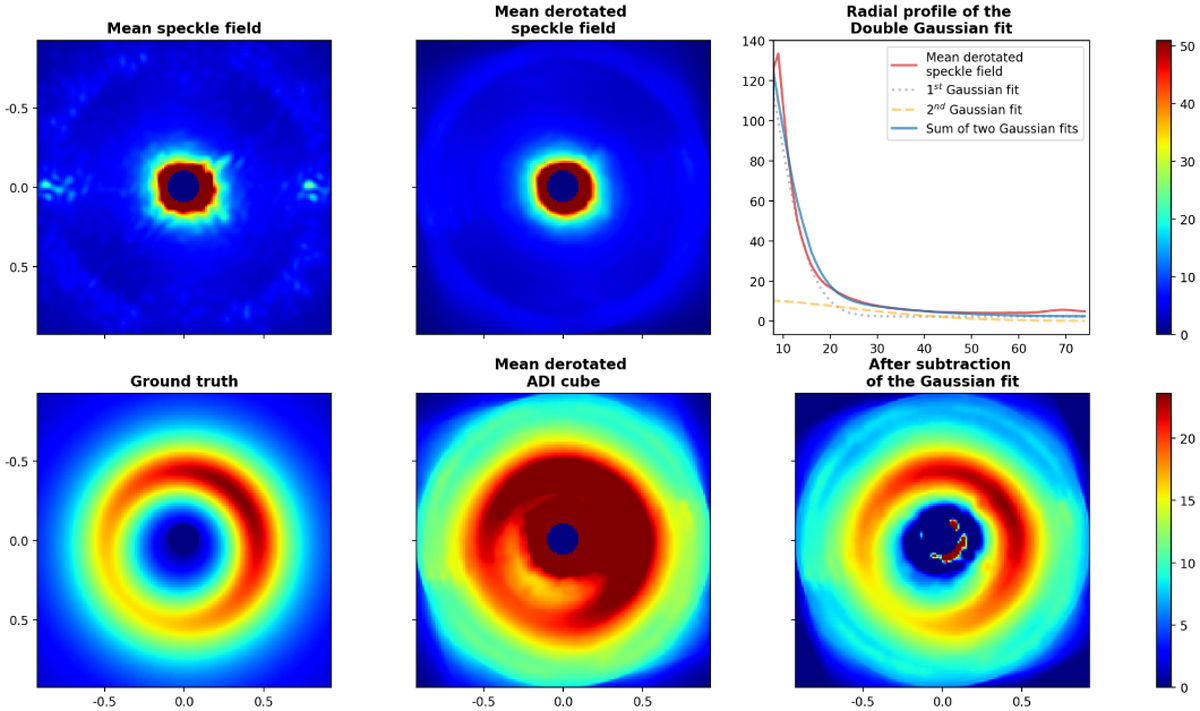
Illustration of the capabilities of an optimal double-Gaussian mask to capture the rotation-invariant stellar residuals. The leftmost two figures in the first row respectively display the mean and the mean de-rotated speckle field before injection of the disk signal. The top-right figure displays the radial profile of the de-rotated empty data set (solid red line) together with the double-Gaussian fit, with the two Gaussians represented in dotted gray and dashed orange, respectively. The solid blue line represents the sum of the two Gaussians. The fit was performed while excluding the pixels within the numerical mask, which is an aperture with an 8-pixel radius. The bottom row shows, from left to right, the disk GT and the mean de-rotated cube after injection before and after subtraction of the optimal Gaussian mask. The figure scales are consistent across all images of each row. Axis values are in arcseconds. The intensity values displayed by the colorbar are arbitrary. This test was conducted using cube #2 with disk D injected at a contrast of 5 × 10⁻⁴.
Current usage metrics show cumulative count of Article Views (full-text article views including HTML views, PDF and ePub downloads, according to the available data) and Abstracts Views on Vision4Press platform.
Data correspond to usage on the plateform after 2015. The current usage metrics is available 48-96 hours after online publication and is updated daily on week days.
Initial download of the metrics may take a while.