Fig. B.1
Download original image
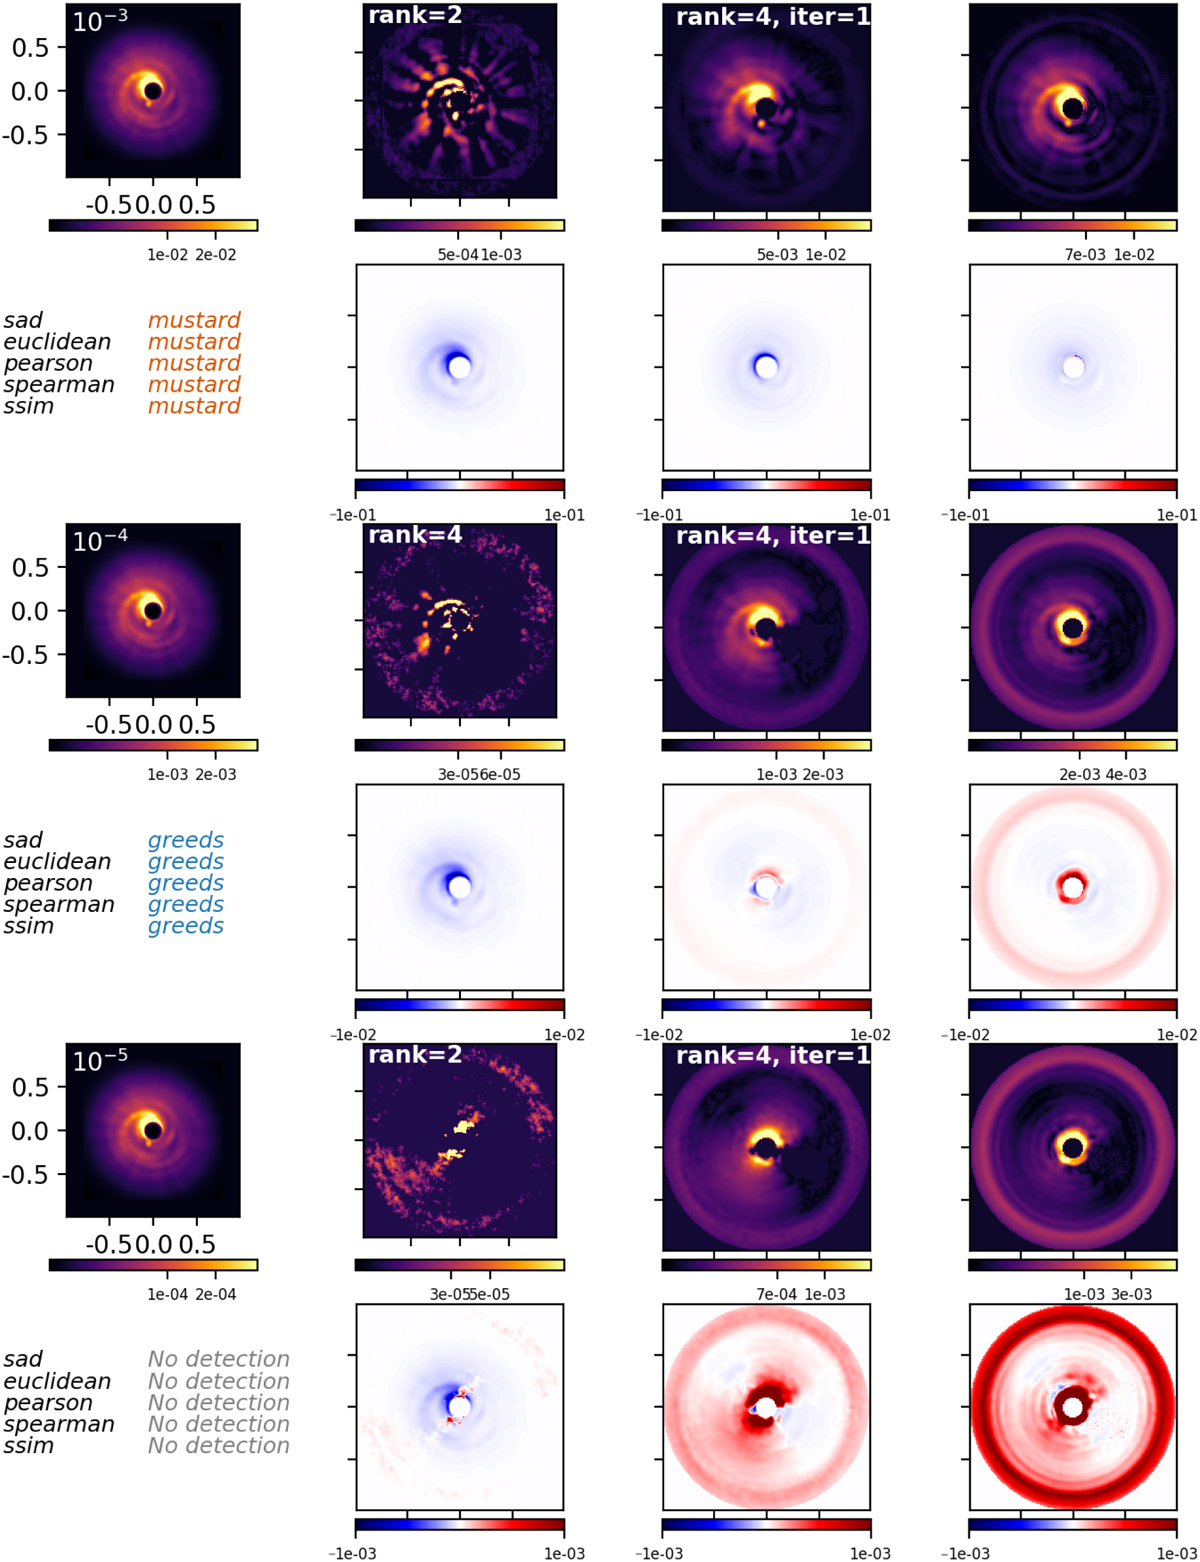
Disk estimations obtained with PCA, I-PCA (GreeDS), and mustard for cube #4 and disk E. Details on the empty data sets can be found in Table 2 and Sect. 4.1. The three pairs of rows correspond to different injected contrast levels: 10−3 (top), 10−4 (middle), and 10−5 (bottom). The top row of each pair shows the estimations, while the bottom row shows the residuals. Each column displays the following: GT (left), PCA (middle-left), I-PCA (middle-right), and mustard (right). The best method, as determined by each metric, is indicated in the bottom-left corner of each pair of rows. More details are provided in the text of Appendix B.
Current usage metrics show cumulative count of Article Views (full-text article views including HTML views, PDF and ePub downloads, according to the available data) and Abstracts Views on Vision4Press platform.
Data correspond to usage on the plateform after 2015. The current usage metrics is available 48-96 hours after online publication and is updated daily on week days.
Initial download of the metrics may take a while.