Fig. 4.
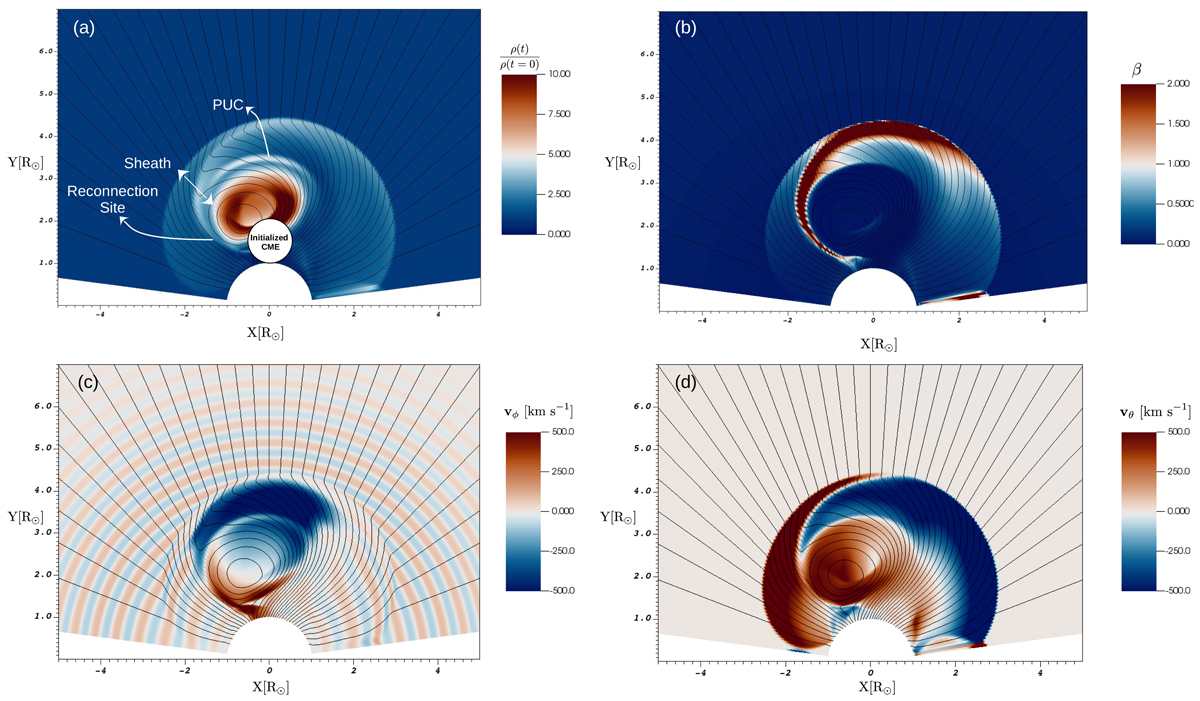
Download original image
Snapshots of CME propagation. The figure presents snapshots of the simulation as the CME is propagating in the low corona at t = 10.8 min. In panel a the colour intensity denotes the density compression compared to the quasi-steady solar wind, with annotations indicating the PUC, sheath, and reconnection site. The plot in panel b shows the plasma beta, and panels c and d present the out-of-plane velocity component vϕ and the co-latitudinal (meridional) component vθ.
Current usage metrics show cumulative count of Article Views (full-text article views including HTML views, PDF and ePub downloads, according to the available data) and Abstracts Views on Vision4Press platform.
Data correspond to usage on the plateform after 2015. The current usage metrics is available 48-96 hours after online publication and is updated daily on week days.
Initial download of the metrics may take a while.