Open Access
Fig. A.2.
Download original image
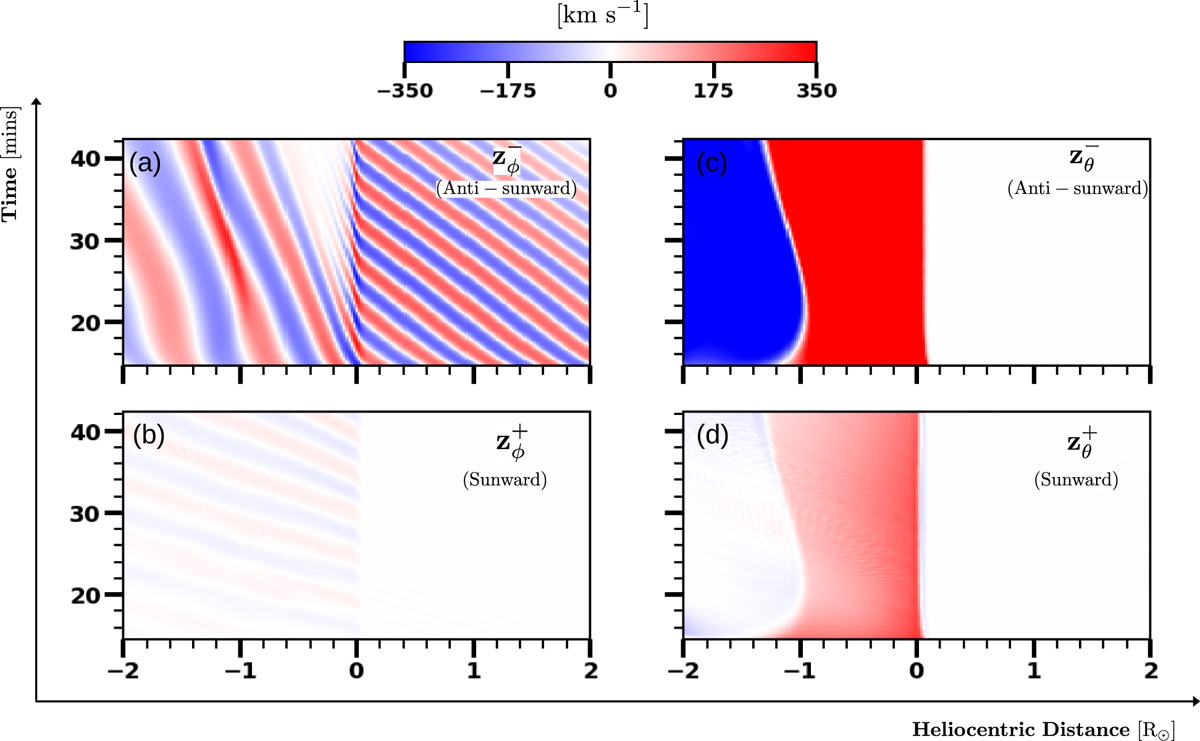
Evolution of the Elsässer variables at the CME flank for the modified simulation grid. Similar to Figure 7, but using a modified grid (higher resolution) between 1.1 R⊙ and 10 R⊙. The x-axis similarly denotes the shock neighbourhood in units of R⊙; the shock is centred at x = 0.
Current usage metrics show cumulative count of Article Views (full-text article views including HTML views, PDF and ePub downloads, according to the available data) and Abstracts Views on Vision4Press platform.
Data correspond to usage on the plateform after 2015. The current usage metrics is available 48-96 hours after online publication and is updated daily on week days.
Initial download of the metrics may take a while.