Fig. A.1.
Download original image
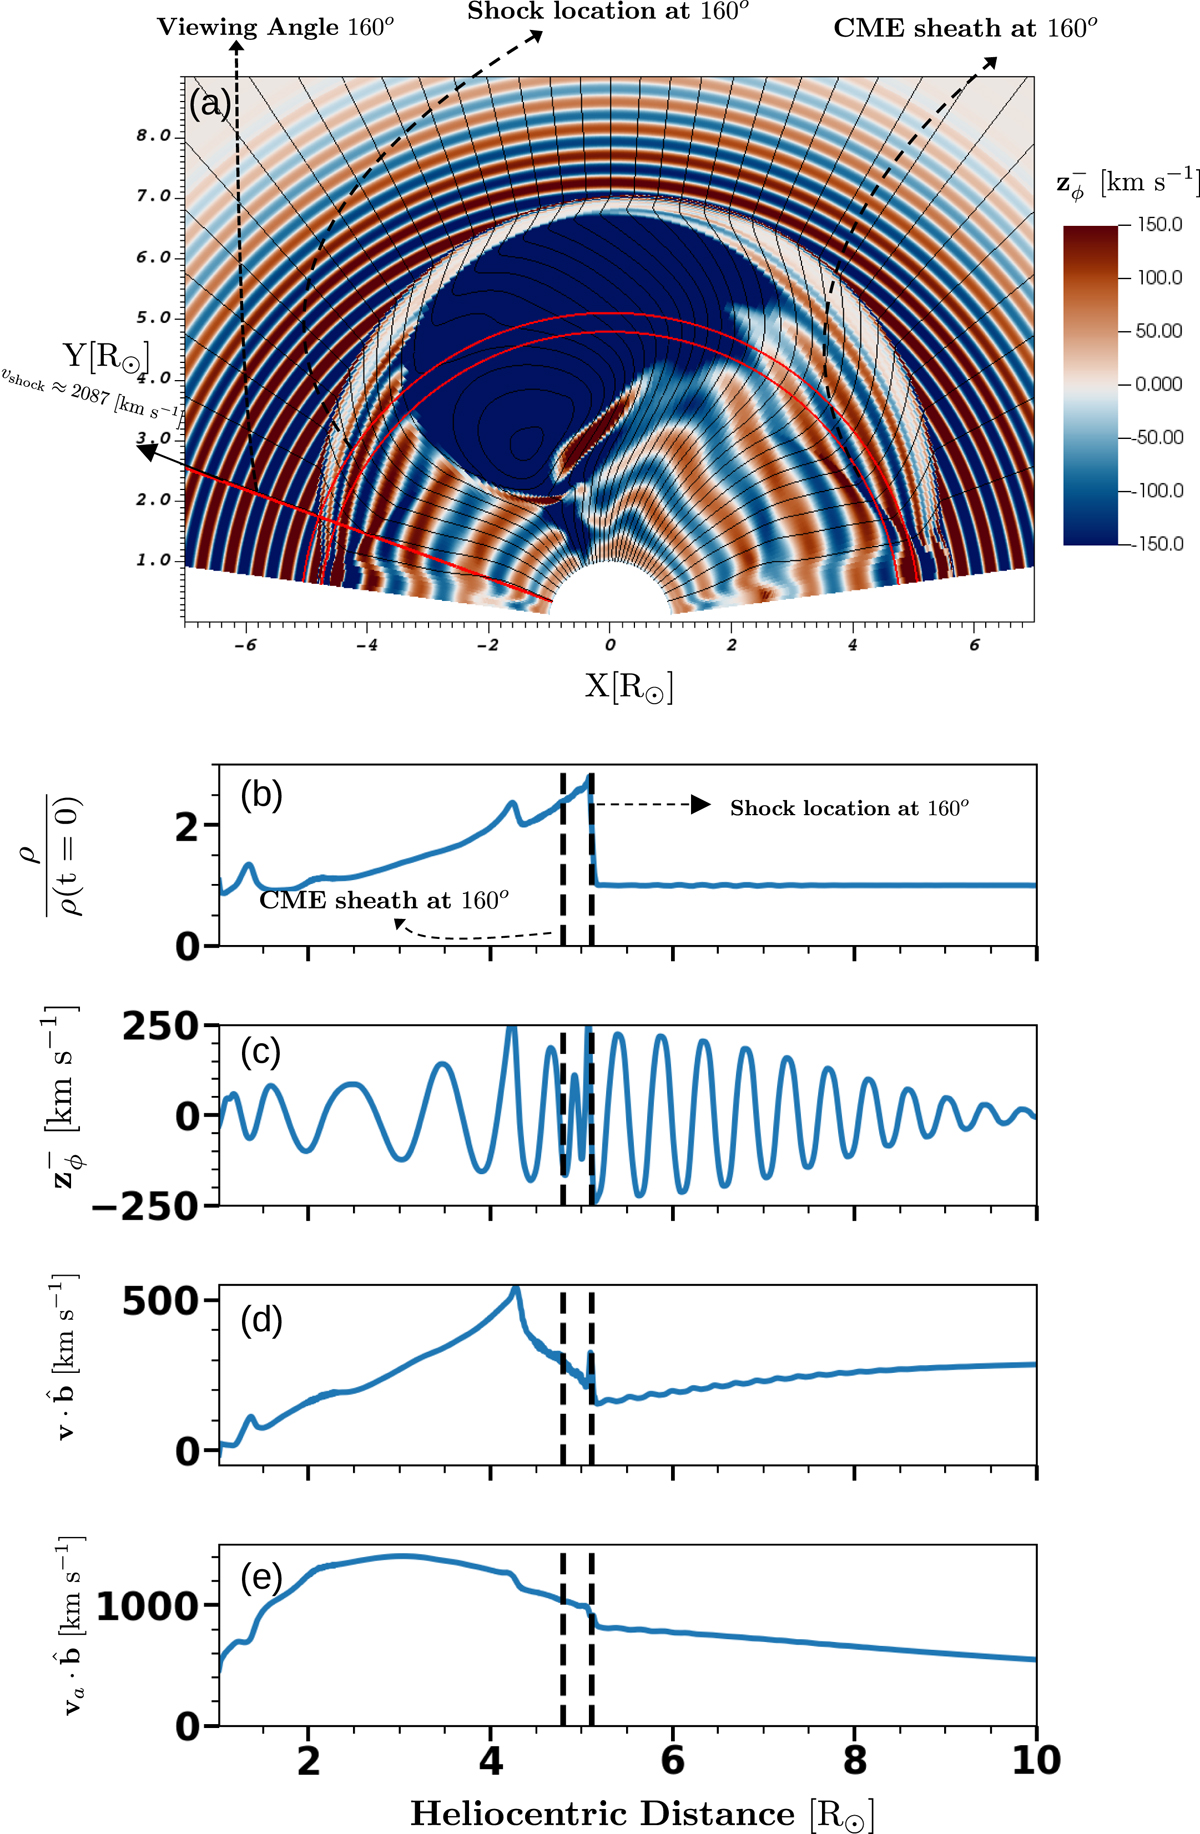
Shock at the CME flank for the modified resolution simulation run. This figure is similar to Figure 8, but with a modified grid (higher resolution) between 1.1 R⊙ and 10 R⊙. Panel (a) shows a simulation snapshot at t = 25 min of the anti-sunward Elsässer variable ![]() with annotations describing the viewing angle along 160°, the shock location, the approximate beginning of the CME sheath, and the approximate shock velocity vshock. Panels (b) and (c) show the density compression and
with annotations describing the viewing angle along 160°, the shock location, the approximate beginning of the CME sheath, and the approximate shock velocity vshock. Panels (b) and (c) show the density compression and ![]() along the viewing angle, respectively. Panels (d) and (e) present the fluid velocity and Alfvén speed along the direction of the background magnetic field.
along the viewing angle, respectively. Panels (d) and (e) present the fluid velocity and Alfvén speed along the direction of the background magnetic field.
Current usage metrics show cumulative count of Article Views (full-text article views including HTML views, PDF and ePub downloads, according to the available data) and Abstracts Views on Vision4Press platform.
Data correspond to usage on the plateform after 2015. The current usage metrics is available 48-96 hours after online publication and is updated daily on week days.
Initial download of the metrics may take a while.