Fig. 10.
Download original image
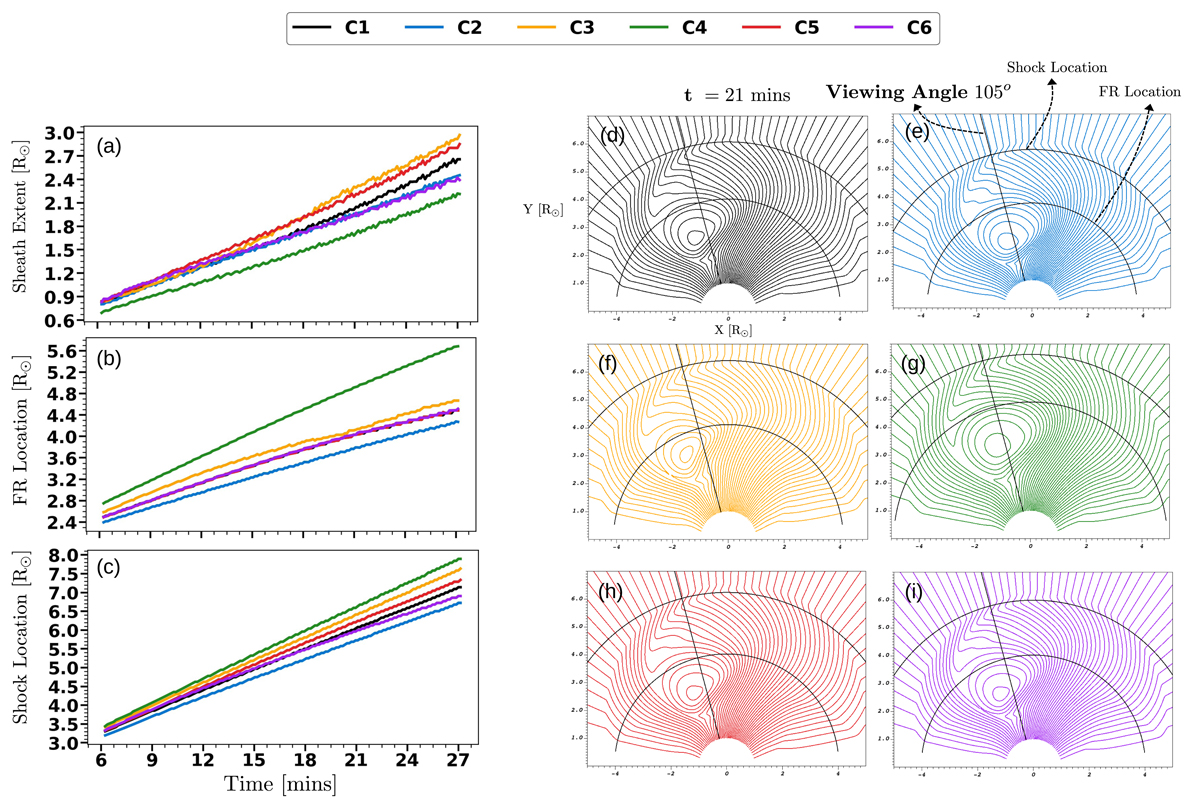
Formation of the CME sheath in the different simulation runs. Shown are the evolution of the radial extent of the sheath (a), the flux rope leading edge (b), and the location of the CME shock along a viewing angle of 105° (c) for the simulation runs detailed in Table 1. The individual runs at time t = 21 min are visualised in (d)–(i); the magnetic field lines are colour-coded according to the case number. In each panel d–i, the viewing angle, the flux rope, and shock locations are also indicated.
Current usage metrics show cumulative count of Article Views (full-text article views including HTML views, PDF and ePub downloads, according to the available data) and Abstracts Views on Vision4Press platform.
Data correspond to usage on the plateform after 2015. The current usage metrics is available 48-96 hours after online publication and is updated daily on week days.
Initial download of the metrics may take a while.