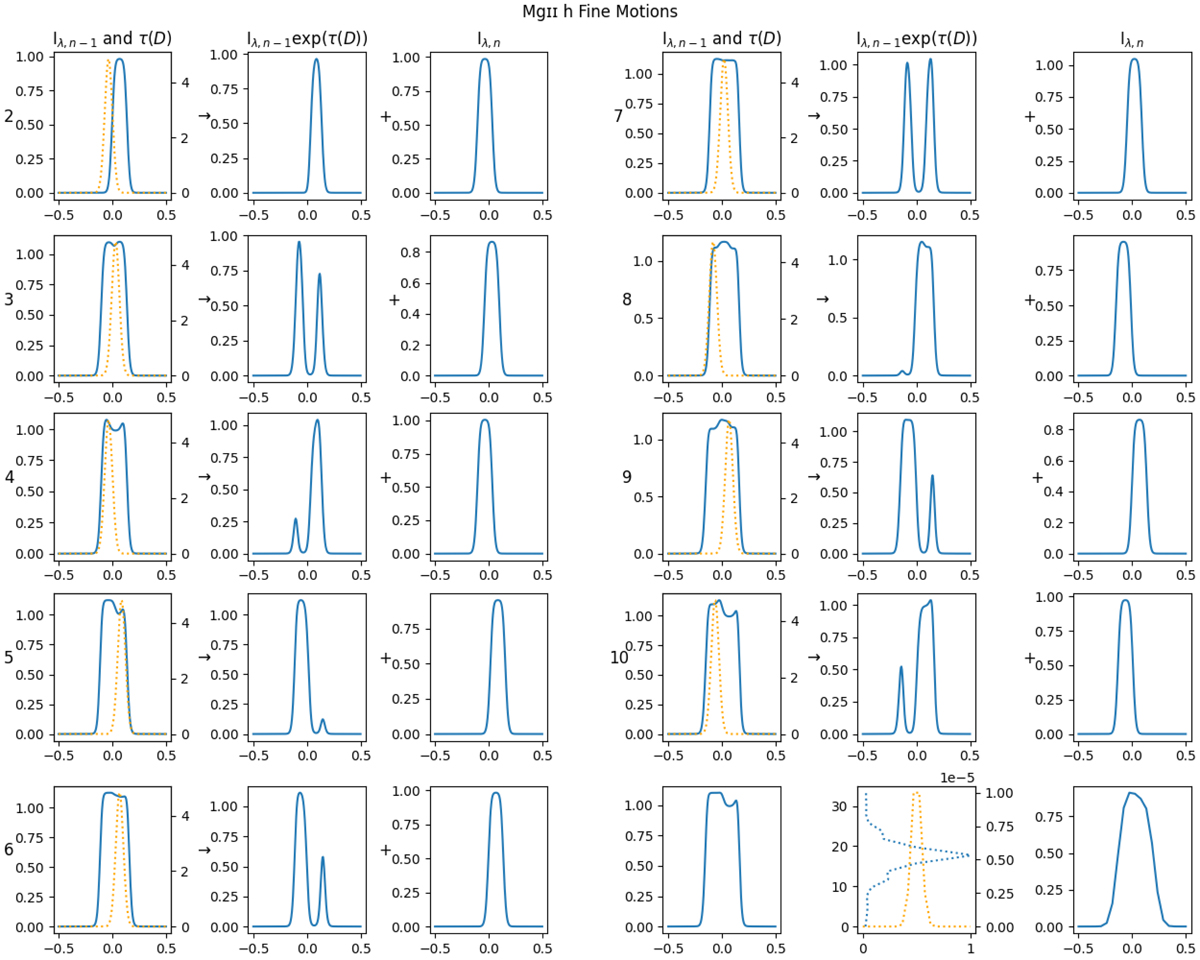
Fig. 6.
Download original image
Formation of line profile asymmetry. It demonstrates the summation of Eq. (3). These line profiles are taken from the centre of the front-most thread. The number to the left of each set of three plots is i. Each set of three plots are elements of the values in Eq. (2) and are as follows: Ii − 1 in blue and τi(s) in dotted orange (left); Ii − 1exp(−τi(s)) in blue (center); Ii (right). The centre and right plots are added together to create the next Ii − 1. The λ subscript denotes that these are wavelength specific intensities. The units on the y-axis are 105 erg s−1 cm−2 Å−1 sr−1. The last three panels are different, and are as follows: I10, leaving the ten threads (left); the IRIS spatial PSF, in dotted blue, where the x-axis is its value normalised such that its peak is 1 and the y-axis is parallel to the slit and the IRIS spectral PSF, in orange, where x is the normalised wavelength and y is its value normalised such that its peak is 1 (centre); the resulting line profile when convolved with the spatial and spectral PSFs of IRIS, and sampled to IRIS resolution (right). This figure originally appeared in Peat (2023).
Current usage metrics show cumulative count of Article Views (full-text article views including HTML views, PDF and ePub downloads, according to the available data) and Abstracts Views on Vision4Press platform.
Data correspond to usage on the plateform after 2015. The current usage metrics is available 48-96 hours after online publication and is updated daily on week days.
Initial download of the metrics may take a while.