Fig. 2.
Download original image
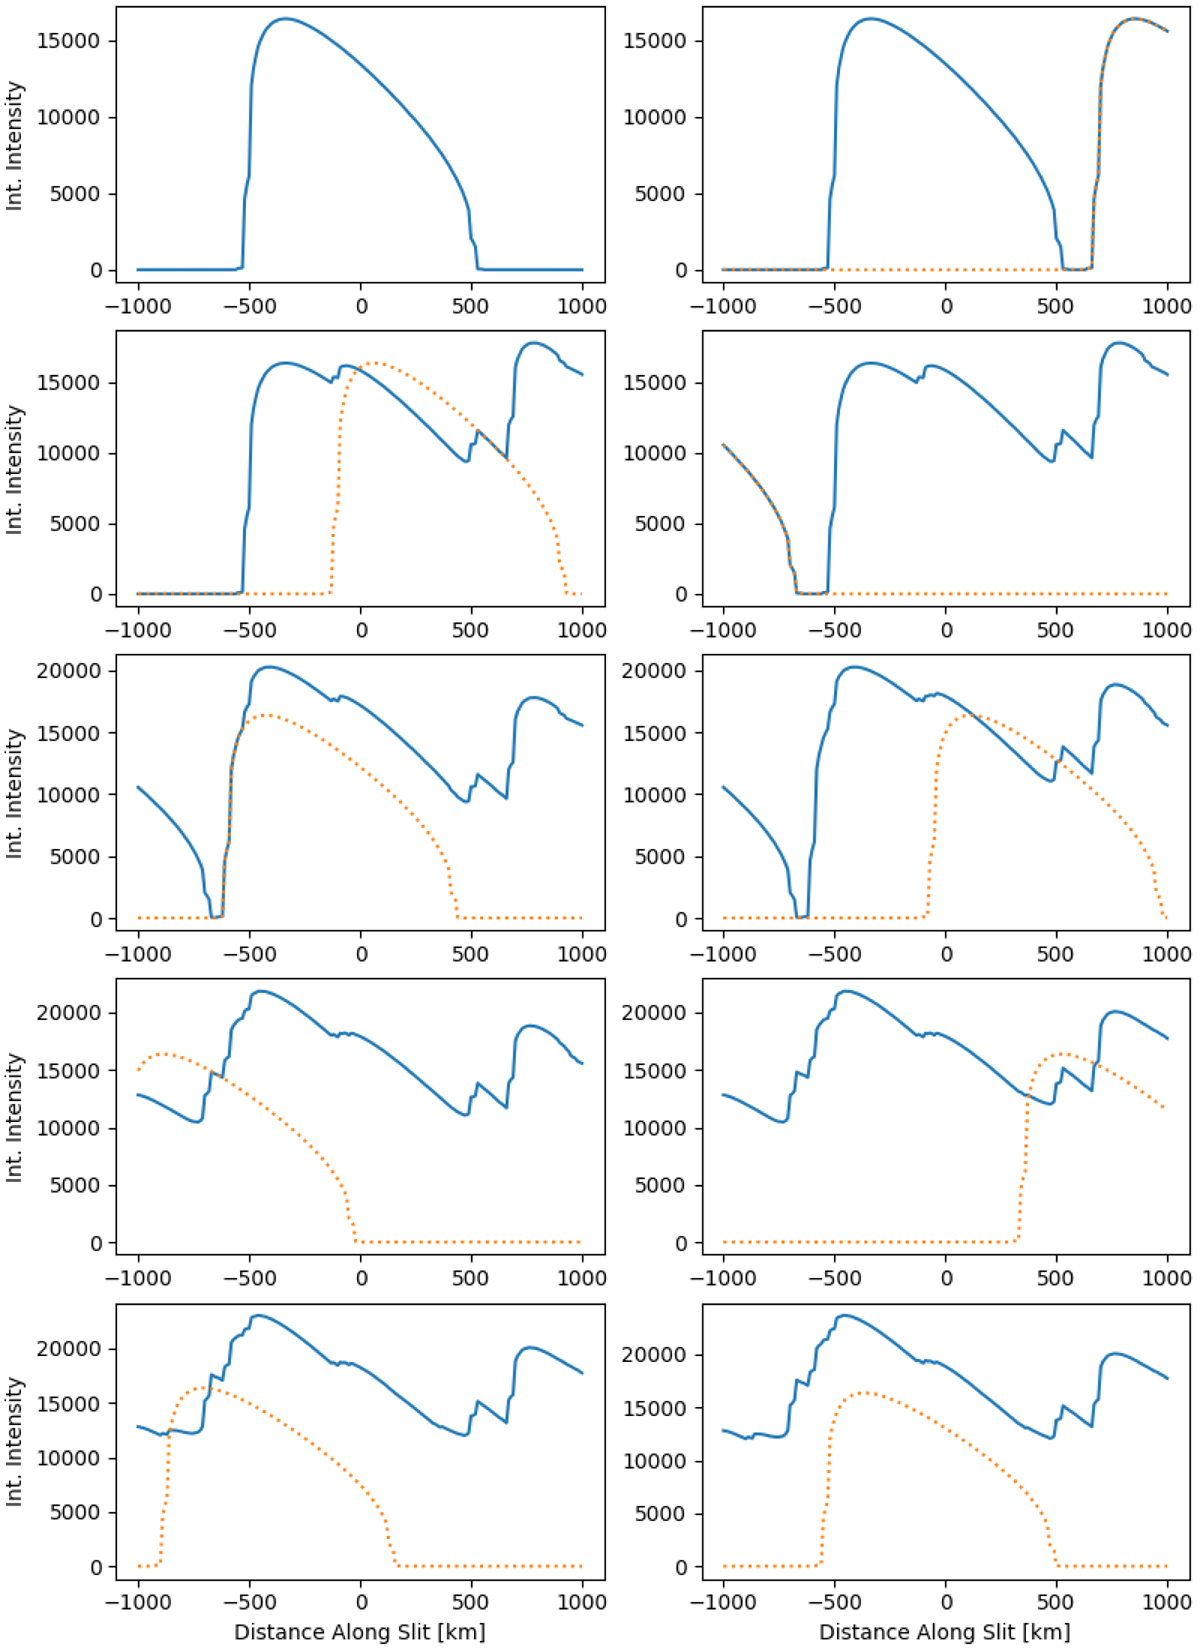
Effect of ten offset threads on integrated intensity along the slit. The first panel (top left) is one thread and each subsequent panel includes one additional thread behind the first. The blue line is the total integrated intensity along the slit, and the dotted orange is the integrated intensity added in this panel. The x-axis is measured relative to the centre of the front-most (10th) thread. The units on the y-axis are erg s−1 cm−2 sr−1. This plot originally appeared in Peat (2023).
Current usage metrics show cumulative count of Article Views (full-text article views including HTML views, PDF and ePub downloads, according to the available data) and Abstracts Views on Vision4Press platform.
Data correspond to usage on the plateform after 2015. The current usage metrics is available 48-96 hours after online publication and is updated daily on week days.
Initial download of the metrics may take a while.