Fig. 10.
Download original image
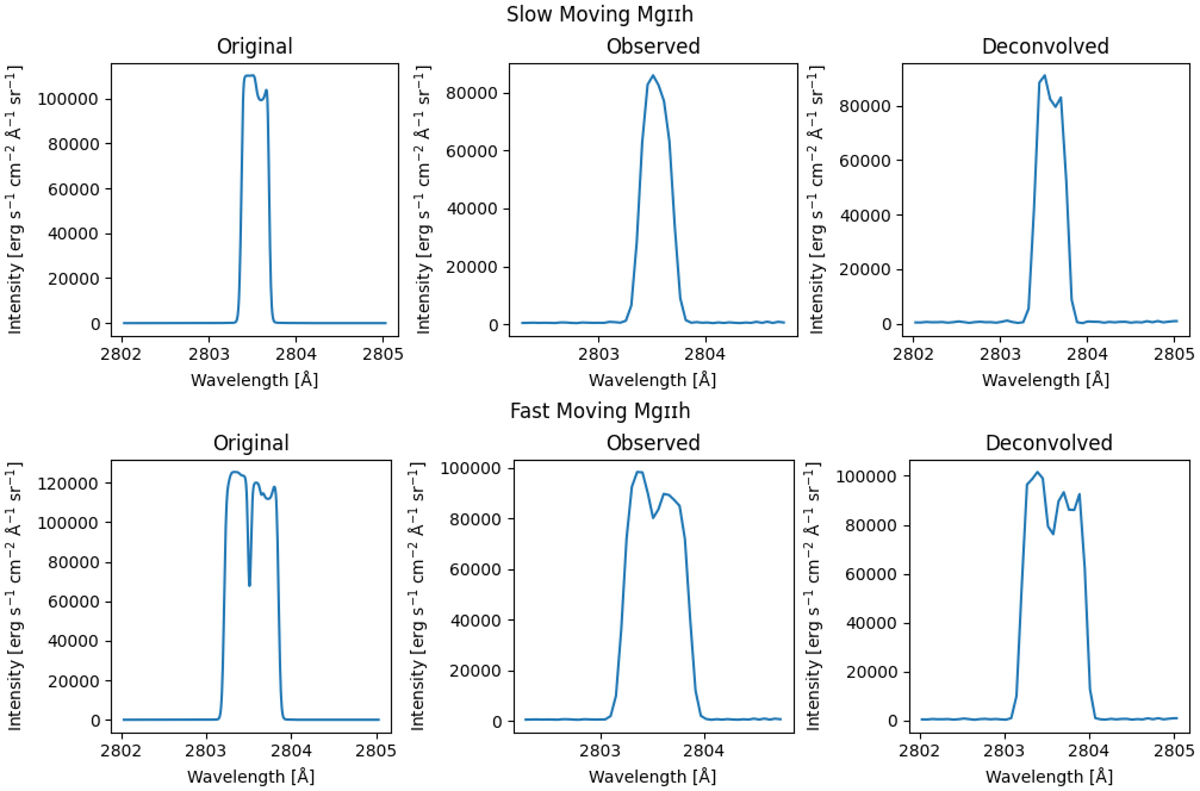
Low- and high-velocity synthetic observations. The upper panels show the low-velocity simulations and the lower panels show the high-velocity simulations. The left panels show the original line profiles. The middle panels show the line profiles as they would be observed by IRIS. The right panels show the line profiles after the Richardson–Lucy deconvolution.
Current usage metrics show cumulative count of Article Views (full-text article views including HTML views, PDF and ePub downloads, according to the available data) and Abstracts Views on Vision4Press platform.
Data correspond to usage on the plateform after 2015. The current usage metrics is available 48-96 hours after online publication and is updated daily on week days.
Initial download of the metrics may take a while.