Fig. 9
Download original image
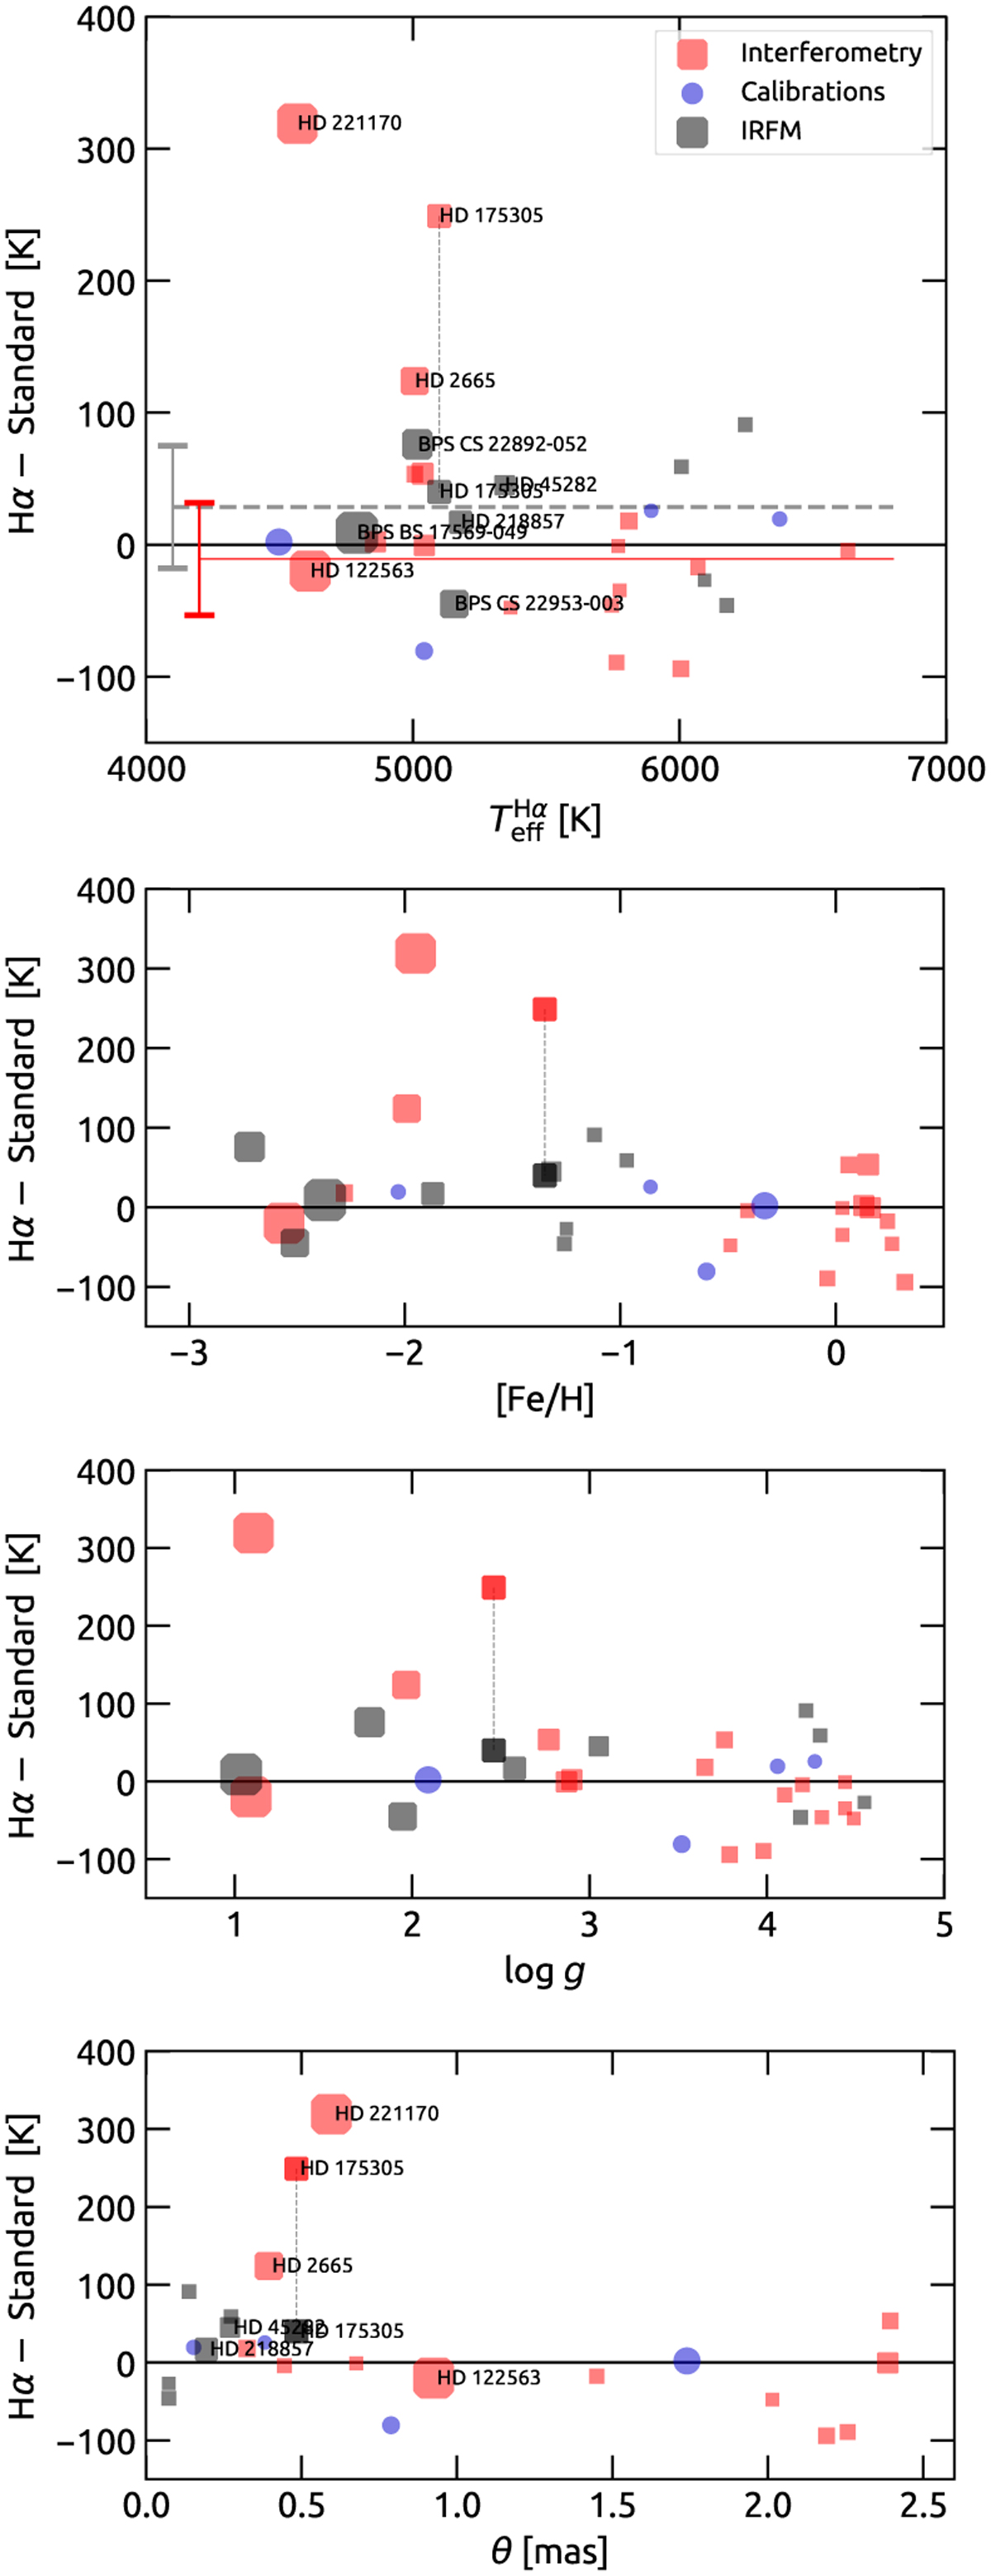
Temperature difference as a function of the atmospheric parameters in Table 2 and the angular diameter in Table 1. The plots include the Gaia benchmarks (see Fig. 7 of Paper I). The stars for which ![]() were derived in this work can be identified by their labels in the top and bottom panels. The stars are colour-coded according to the method used to infer their standard Teff in the literature: direct application of interferometry (red), indirect interferometry based in colour calibrations (blue), and IRFM (grey). The symbol sizes are inversely proportional to the log ɡ values. The two temperature measurements of HD 175305 (see Table 1) are connected by a vertical dashed line. The red (dashed grey) line at −11 K (+28 K) indicates the median of the differences between Hα temperatures and those derived from interferometry (from IRFM), computed omitting HD 221170, HD 175305, and HD 2665. Their dispersion of 42 K (46 K) is indicated by the error bar with the same colour.
were derived in this work can be identified by their labels in the top and bottom panels. The stars are colour-coded according to the method used to infer their standard Teff in the literature: direct application of interferometry (red), indirect interferometry based in colour calibrations (blue), and IRFM (grey). The symbol sizes are inversely proportional to the log ɡ values. The two temperature measurements of HD 175305 (see Table 1) are connected by a vertical dashed line. The red (dashed grey) line at −11 K (+28 K) indicates the median of the differences between Hα temperatures and those derived from interferometry (from IRFM), computed omitting HD 221170, HD 175305, and HD 2665. Their dispersion of 42 K (46 K) is indicated by the error bar with the same colour.
Current usage metrics show cumulative count of Article Views (full-text article views including HTML views, PDF and ePub downloads, according to the available data) and Abstracts Views on Vision4Press platform.
Data correspond to usage on the plateform after 2015. The current usage metrics is available 48-96 hours after online publication and is updated daily on week days.
Initial download of the metrics may take a while.