Fig. 7
Download original image
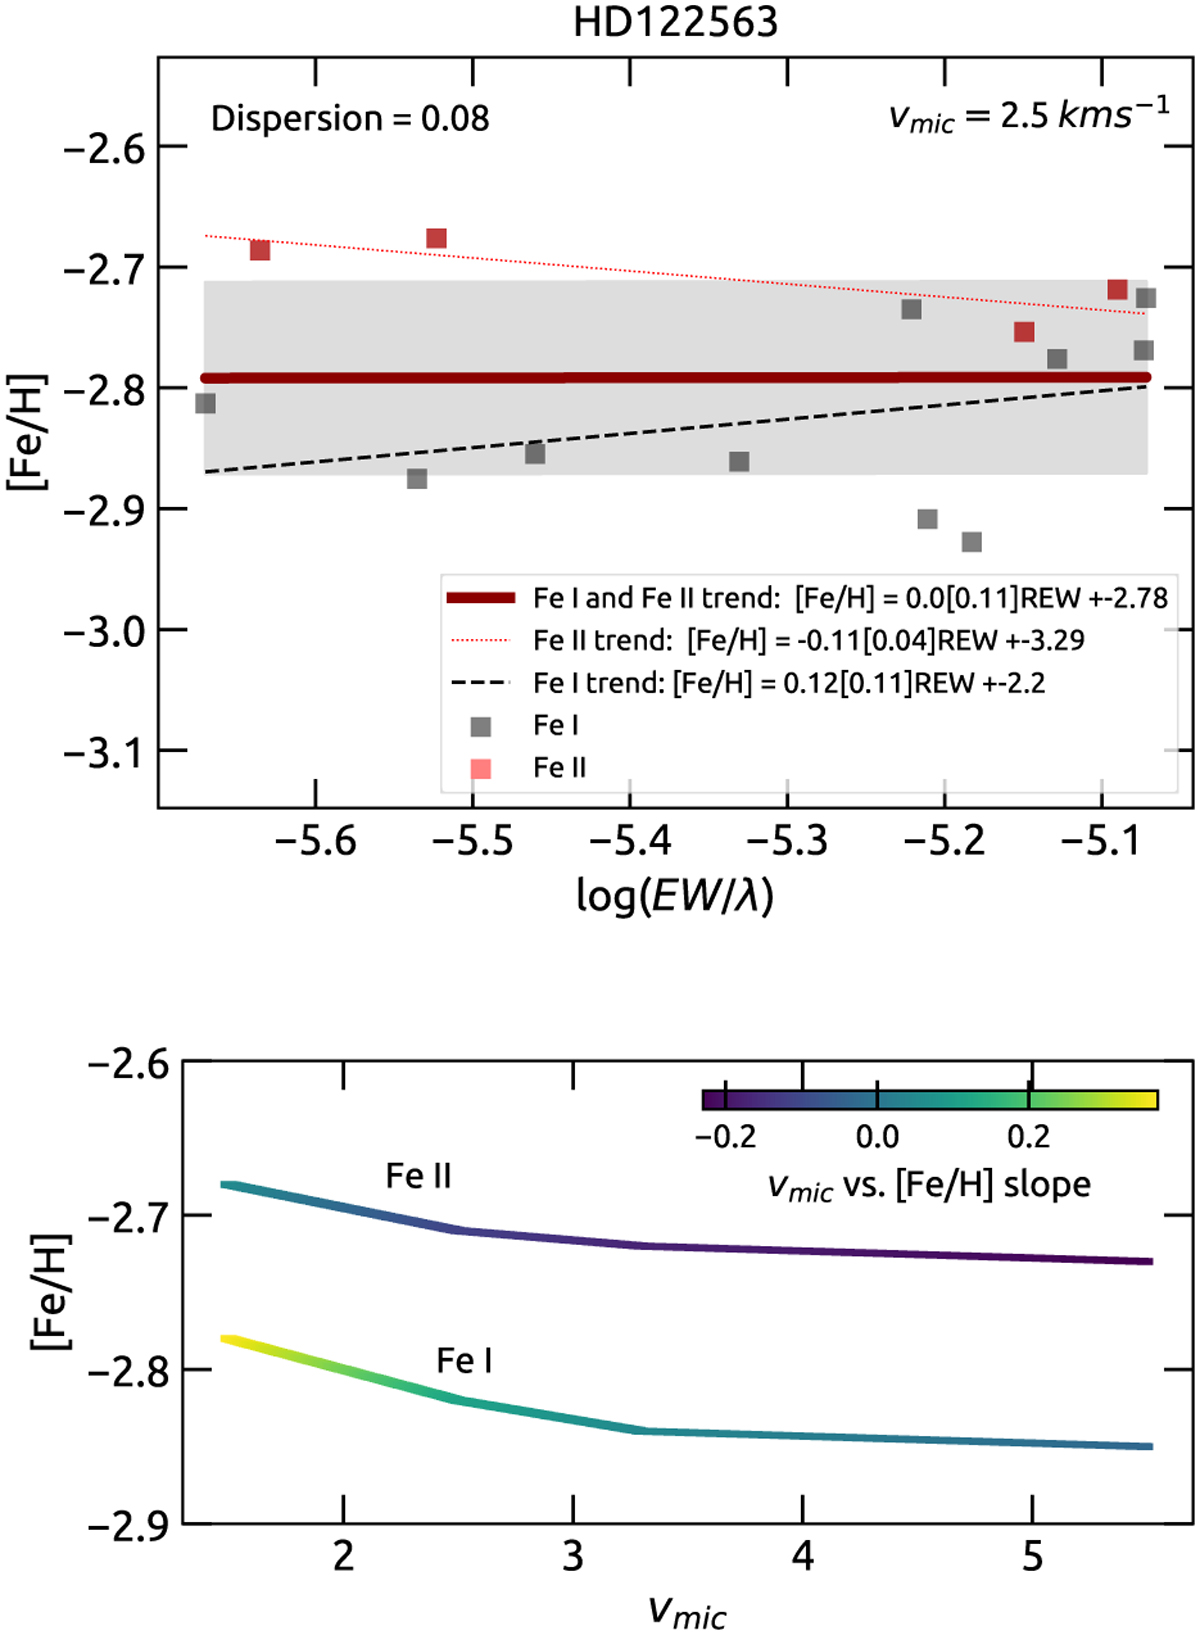
Metallicity determination of the star HD 122563. Top panel: line-to-line Fe abundances computed with υmic = 2.5 km s−1 as a function of the reduced equivalent width. Grey and red dots represent Fe I and Fe II lines, respectively. The solid dark red line is the trend of all Fe I and Fe II measurements. The black dashed and red dotted lines are the trends of Fe I and Fe II measurements, respectively. The shade represents the dispersion. Bottom panel: for HD 122563, metallicity as function of υmic colour-coded by the slope of the trends in the υmic–[Fe/H] plane.
Current usage metrics show cumulative count of Article Views (full-text article views including HTML views, PDF and ePub downloads, according to the available data) and Abstracts Views on Vision4Press platform.
Data correspond to usage on the plateform after 2015. The current usage metrics is available 48-96 hours after online publication and is updated daily on week days.
Initial download of the metrics may take a while.