Fig. A.2
Download original image
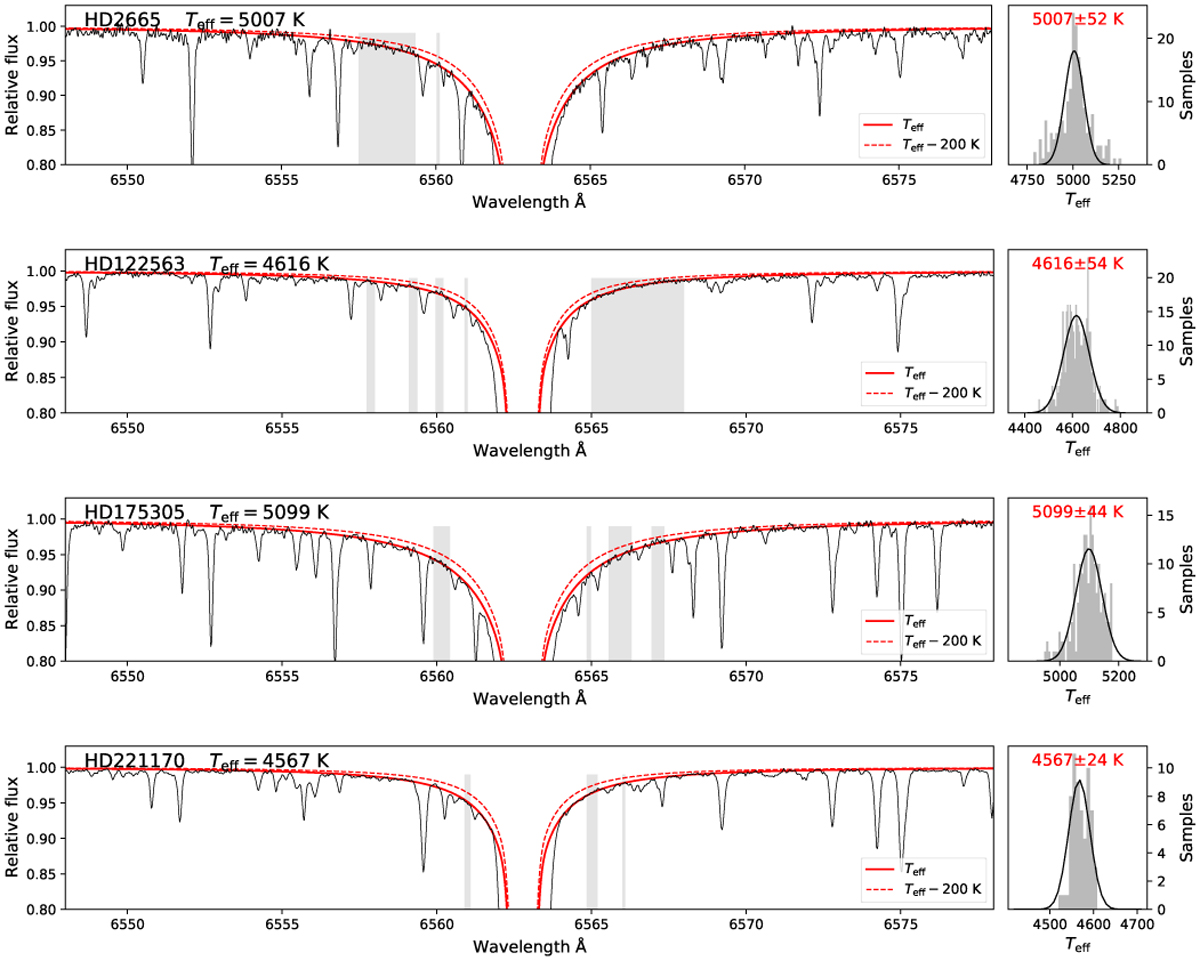
Hα profile fits of stars with interſerometric measurements. Left panels: Observational spectra are in black, whereas fitted synthetic Ha lines are represented by red continuous lines. A synthetic profile with −200 K is represented by the red dashed line to provide a view of the sensitivity of the flux along the wavelength axis. Shades indicate the windows of fits without metal or telluric lines. Right panels: Histograms of the temperatures associated to each wavelength bin inside of the windows of the fits. Gaussians fitted to the histograms are represented in black, whose peak centers and 1σ dispersions are indicated in red. They correspond to the determined ![]() and their fitting errors.
and their fitting errors.
Current usage metrics show cumulative count of Article Views (full-text article views including HTML views, PDF and ePub downloads, according to the available data) and Abstracts Views on Vision4Press platform.
Data correspond to usage on the plateform after 2015. The current usage metrics is available 48-96 hours after online publication and is updated daily on week days.
Initial download of the metrics may take a while.