Open Access
Fig. A.1
Download original image
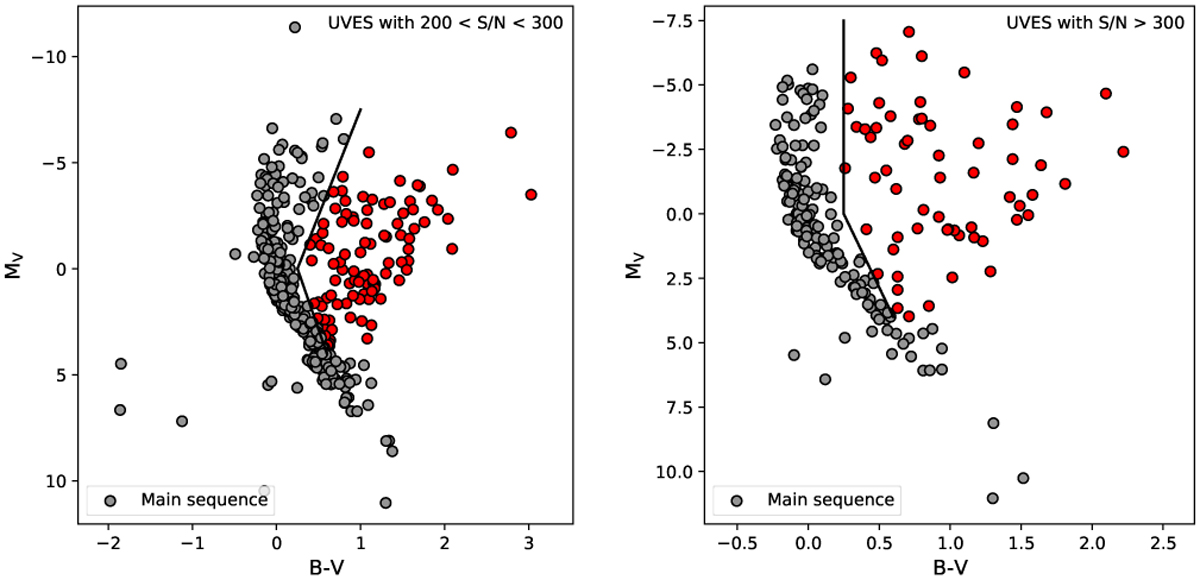
Examples of the initial selection of red giants with UVES spectra in the ESO archive. The left panel displays stars with spectra of 200 ≤ S/N≤ 300, whereas the right panel shows stars with S/N > 300. The limits set are to separate main sequence stars (grey symbols) from red giant candidates (red symbols) and are arbitrary.
Current usage metrics show cumulative count of Article Views (full-text article views including HTML views, PDF and ePub downloads, according to the available data) and Abstracts Views on Vision4Press platform.
Data correspond to usage on the plateform after 2015. The current usage metrics is available 48-96 hours after online publication and is updated daily on week days.
Initial download of the metrics may take a while.