Fig. 17
Download original image
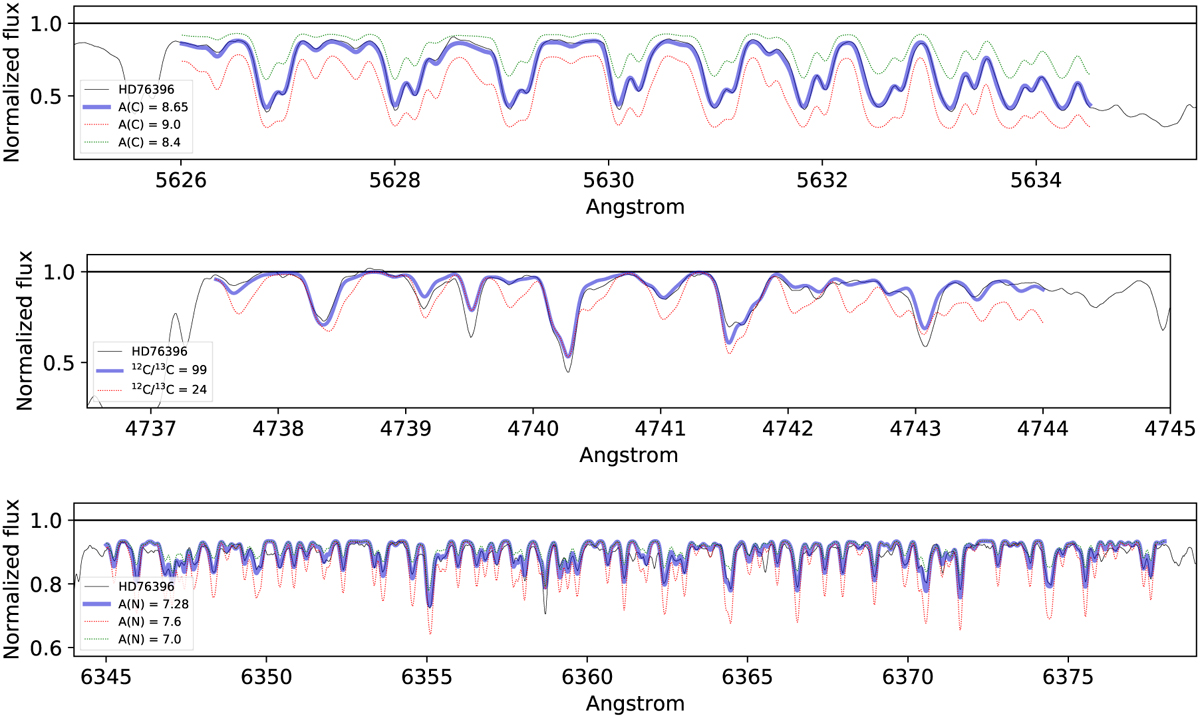
Spectral fits for the determination of С in the C2 band (top panel), of the 12C to 13C ratio (middle panel), and of N in the CN band (bottom panel). Black lines represent the observational spectrum of HD 76396, blue lines represent the best modelled spectrum with abundances given in the legends, and green and red dotted lines represent modelled spectra with other abundances.
Current usage metrics show cumulative count of Article Views (full-text article views including HTML views, PDF and ePub downloads, according to the available data) and Abstracts Views on Vision4Press platform.
Data correspond to usage on the plateform after 2015. The current usage metrics is available 48-96 hours after online publication and is updated daily on week days.
Initial download of the metrics may take a while.