Fig. 16
Download original image
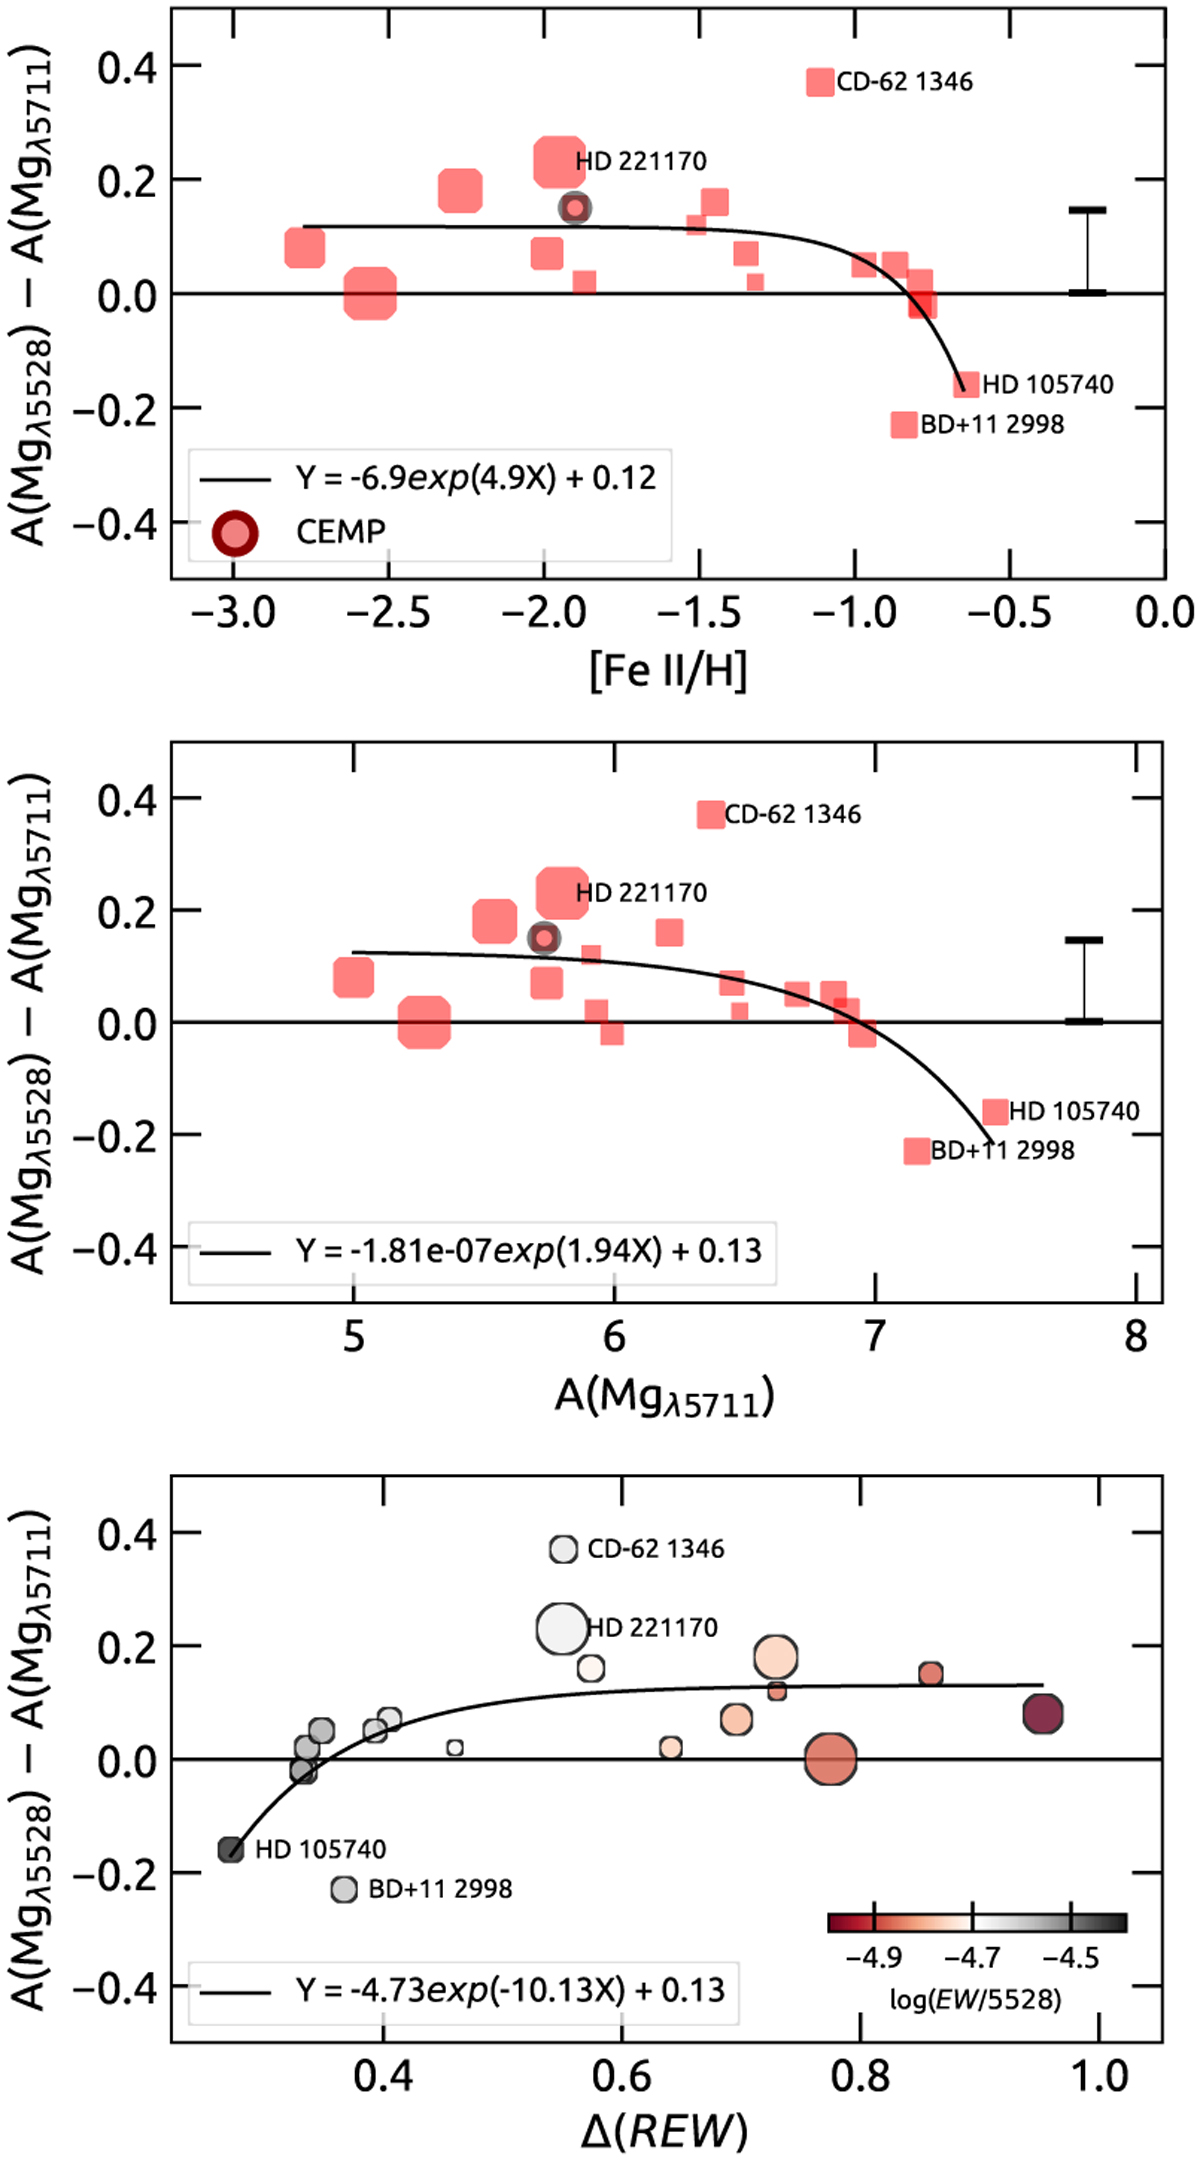
Consistency of Mg abundance from the lines 5528 and 5711 Å. The top panel shows abundance differences as a function of metallicity, the middle panel displays the same differences as a function of the Mg abundance of the 5711 A line, and the bottom panel shows these differences as a function of the difference between log(EW5528Å/5528) and log(EW5711Å/5711). Symbols are colour-coded according to the reduced equivalent width of the line 5528 A in logarithmic scale. Symbols sizes are inversely proportional to log ɡ. Exponentials are fitted to the distributions in all panels. Stars with the largest discrepancies are tagged by their identifiers. 1σ errors (±0.07) around the average (+0.07) are represented by the error bars.
Current usage metrics show cumulative count of Article Views (full-text article views including HTML views, PDF and ePub downloads, according to the available data) and Abstracts Views on Vision4Press platform.
Data correspond to usage on the plateform after 2015. The current usage metrics is available 48-96 hours after online publication and is updated daily on week days.
Initial download of the metrics may take a while.