Fig. 14
Download original image
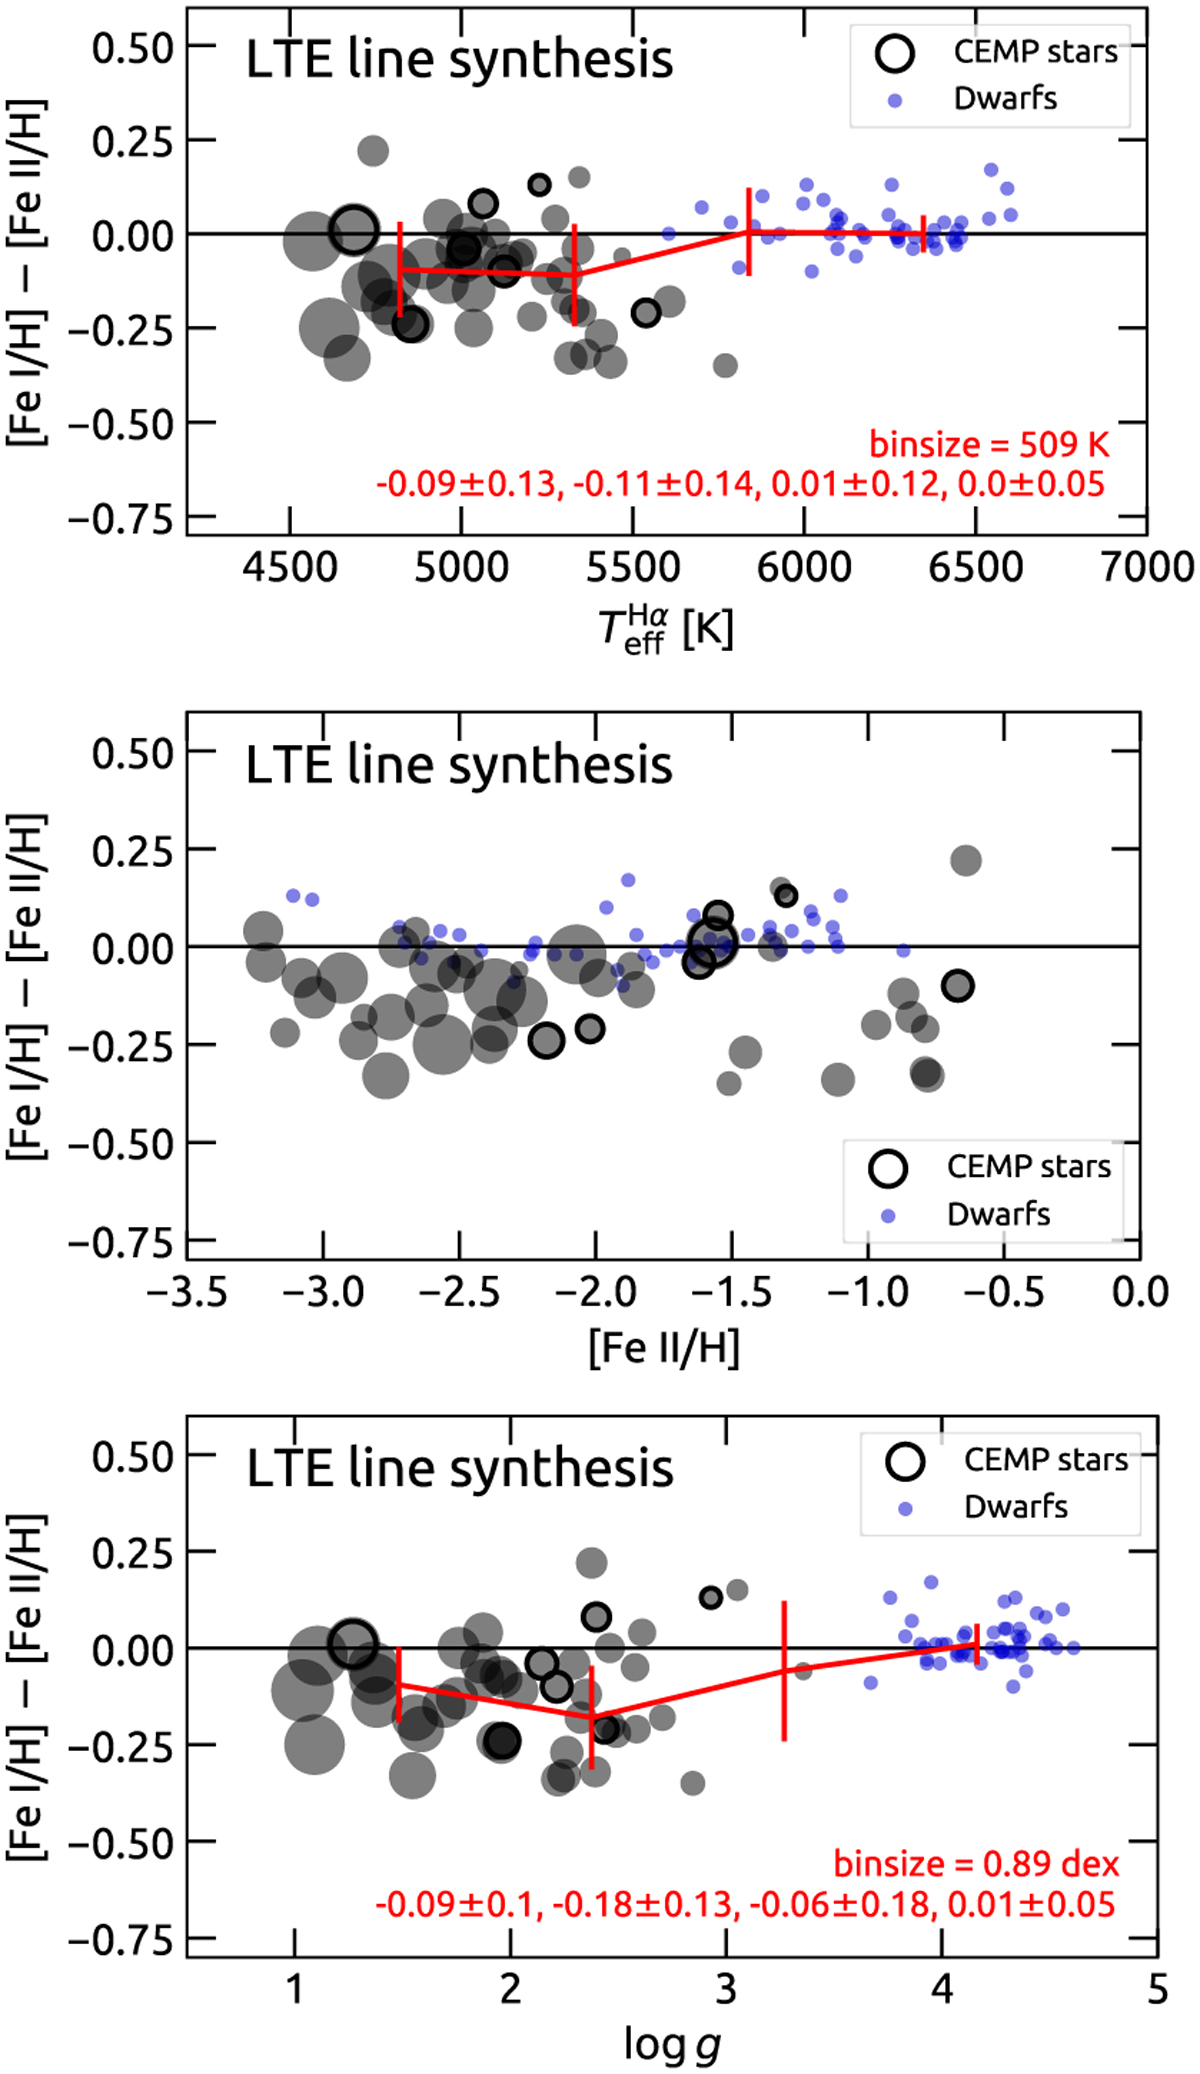
Deviation from ionisation balance as a function of the atmospheric parameters. Dwarf stars from Paper I are plotted in blue, and CEMP stars are highlighted with dark contours. The symbol sizes are inversely proportional to log ɡ. The red lines in the top and bottom panels connect medians computed in equally spaced bins of Teff and log ɡ, respectively; medians and bin sizes are indicated in the plots. The vertical bars correspond to 1σ standard deviations; the corresponding values are indicated in the plots as well.
Current usage metrics show cumulative count of Article Views (full-text article views including HTML views, PDF and ePub downloads, according to the available data) and Abstracts Views on Vision4Press platform.
Data correspond to usage on the plateform after 2015. The current usage metrics is available 48-96 hours after online publication and is updated daily on week days.
Initial download of the metrics may take a while.