Fig. 13
Download original image
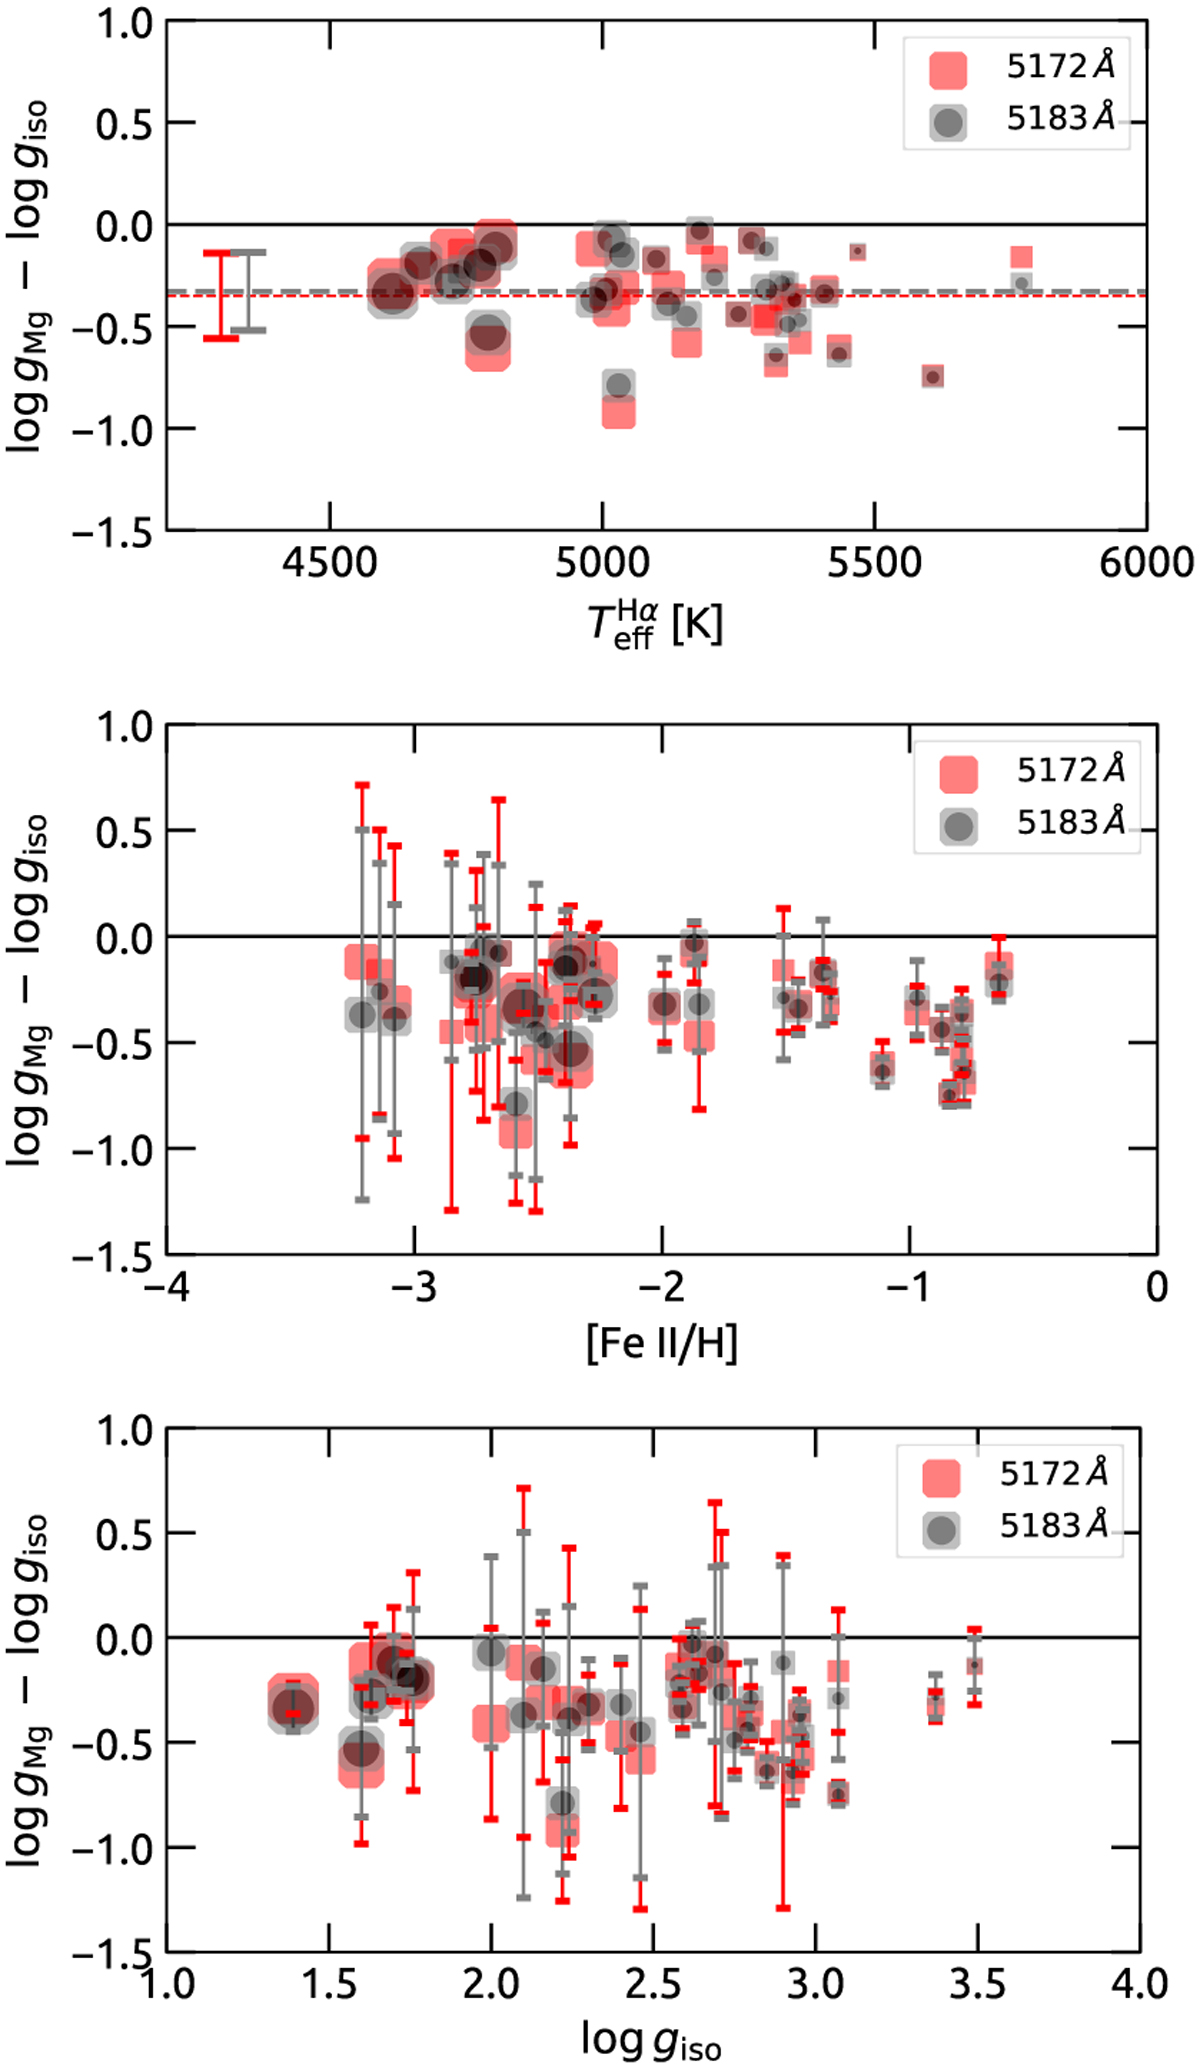
Surface-gravity differences as a function of the atmospheric parameters. The size of each symbol is inversely proportional to log ɡiso. The points are coded in red or grey depending on the Mg I line (5172 Å or 5183 Å) used to compute log ɡMg log ɡiso In the top panel, the offsets and ± 1σ dispersions are represented by the dashed lines and error bars, the values of which are −0.35 ± 0.21 for the line at 5172 A (in red) and −0.33 ± 0.19 for the line at 5183 Å (in grey). Individual log ɡ values are listed in Table A.1. Error bars in the middle and bottom plots are the quadratic sum of the errors of log ɡiso and those of log ɡMg
Current usage metrics show cumulative count of Article Views (full-text article views including HTML views, PDF and ePub downloads, according to the available data) and Abstracts Views on Vision4Press platform.
Data correspond to usage on the plateform after 2015. The current usage metrics is available 48-96 hours after online publication and is updated daily on week days.
Initial download of the metrics may take a while.