Fig. 11
Download original image
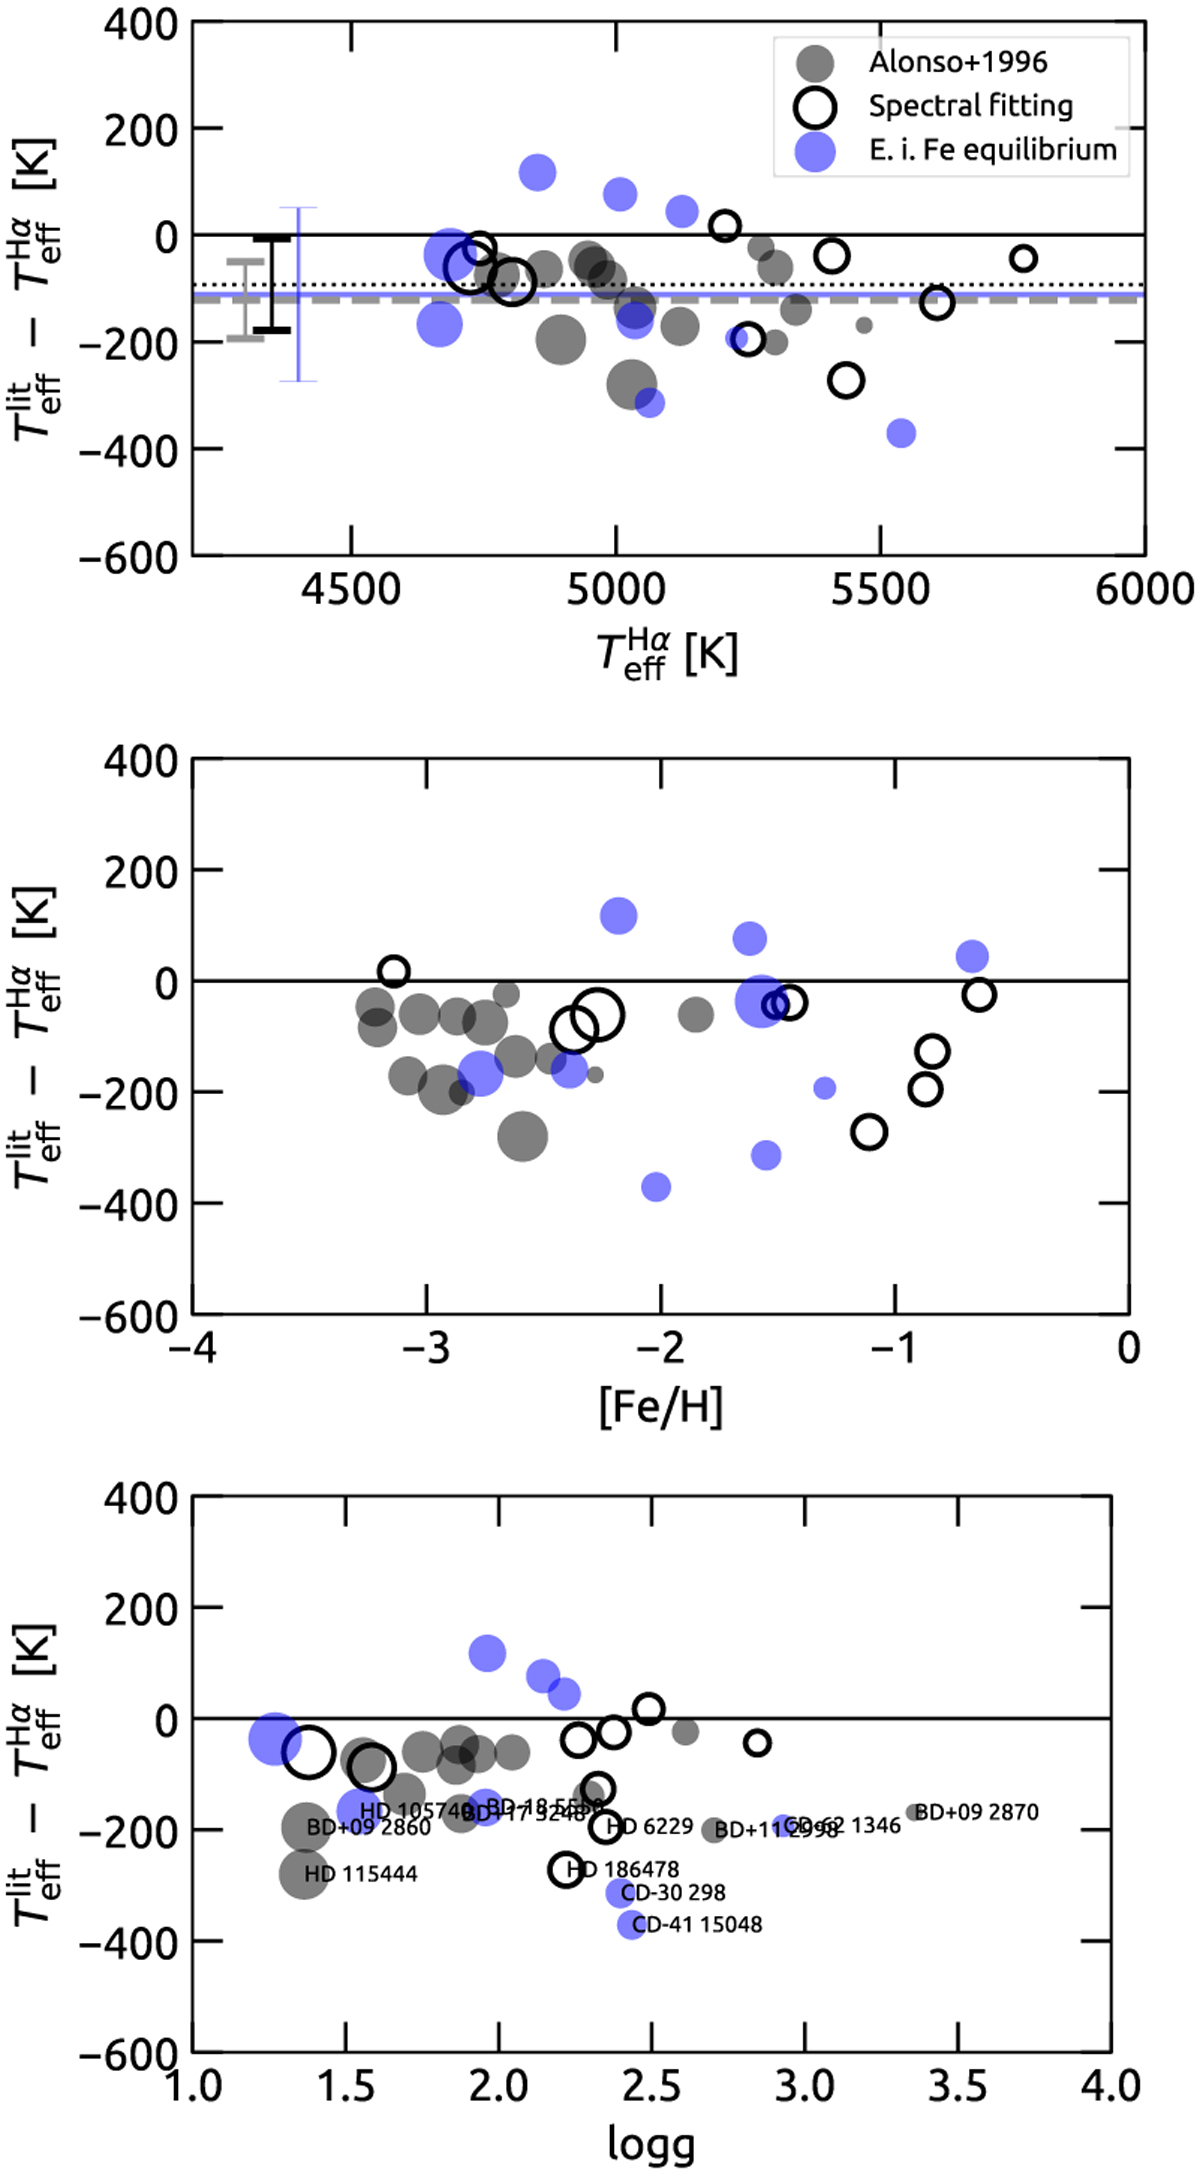
Comparison between ![]() and preliminary temperatures from the literature (
and preliminary temperatures from the literature (![]() ) compiled in Table 1 as function of the atmospheric parameters. The size of the symbols is inversely proportional to log ɡ in Table 2. The symbols distinguish the method with which
) compiled in Table 1 as function of the atmospheric parameters. The size of the symbols is inversely proportional to log ɡ in Table 2. The symbols distinguish the method with which ![]() was derived: Grey circles show colour–Teff relations of Alonso et al. (1996), black contour circles show spectral fitting, and blue circles show excitation and ionisation equilibrium of Fe lines. The grey dashed, black dotted, and blue lines represent the mean offsets of the scales of –93, –122, and –105 K, respectively. Error bars are 1σ dispersions and correspond to symbol colours: 72, 86, and 169 K, respectively. The bottom panel includes labels with the names of the stars with discrepancies higher than 150 k.
was derived: Grey circles show colour–Teff relations of Alonso et al. (1996), black contour circles show spectral fitting, and blue circles show excitation and ionisation equilibrium of Fe lines. The grey dashed, black dotted, and blue lines represent the mean offsets of the scales of –93, –122, and –105 K, respectively. Error bars are 1σ dispersions and correspond to symbol colours: 72, 86, and 169 K, respectively. The bottom panel includes labels with the names of the stars with discrepancies higher than 150 k.
Current usage metrics show cumulative count of Article Views (full-text article views including HTML views, PDF and ePub downloads, according to the available data) and Abstracts Views on Vision4Press platform.
Data correspond to usage on the plateform after 2015. The current usage metrics is available 48-96 hours after online publication and is updated daily on week days.
Initial download of the metrics may take a while.