Fig. 10
Download original image
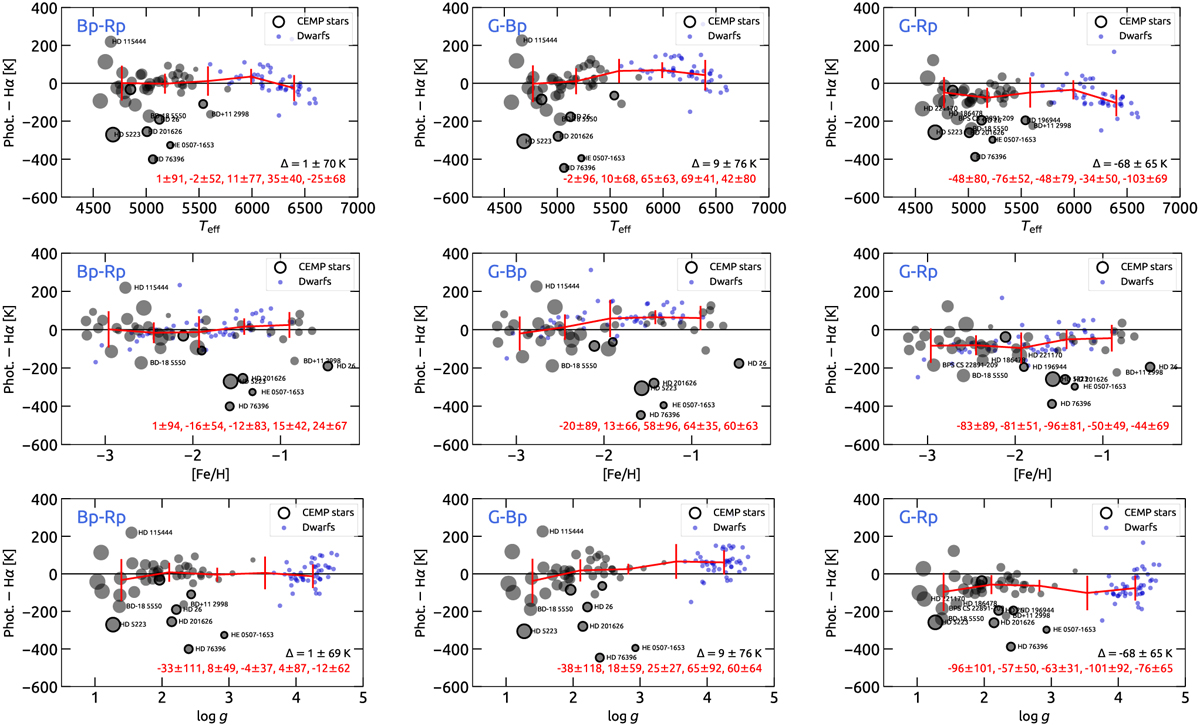
Comparison between effective temperatures from the colour–Teff relations of Casagrande et al. (2021) and those derived by Hα in this work. Each column corresponds to one Gaia colour, and each row shows the distribution of the differences with respect to Teff, [Fe/H], and log ɡ, respectively. TITANS I dwarfs are plotted in blue, and CEMP stars are highlighted with dark contours. The symbol sizes are inversely proportional to log ɡ. Red lines connect medians computed in equally spaced bins, and vertical bars correspond to 1σ dispersions; their values are indicated in red characters. Medians and corresponding 1σ dispersions for only the giants (grey symbols) – omitting CEMP stars – are given in red characters. Giants with temperature differences of greater than 2σ are labelled with their catalogue numbers.
Current usage metrics show cumulative count of Article Views (full-text article views including HTML views, PDF and ePub downloads, according to the available data) and Abstracts Views on Vision4Press platform.
Data correspond to usage on the plateform after 2015. The current usage metrics is available 48-96 hours after online publication and is updated daily on week days.
Initial download of the metrics may take a while.