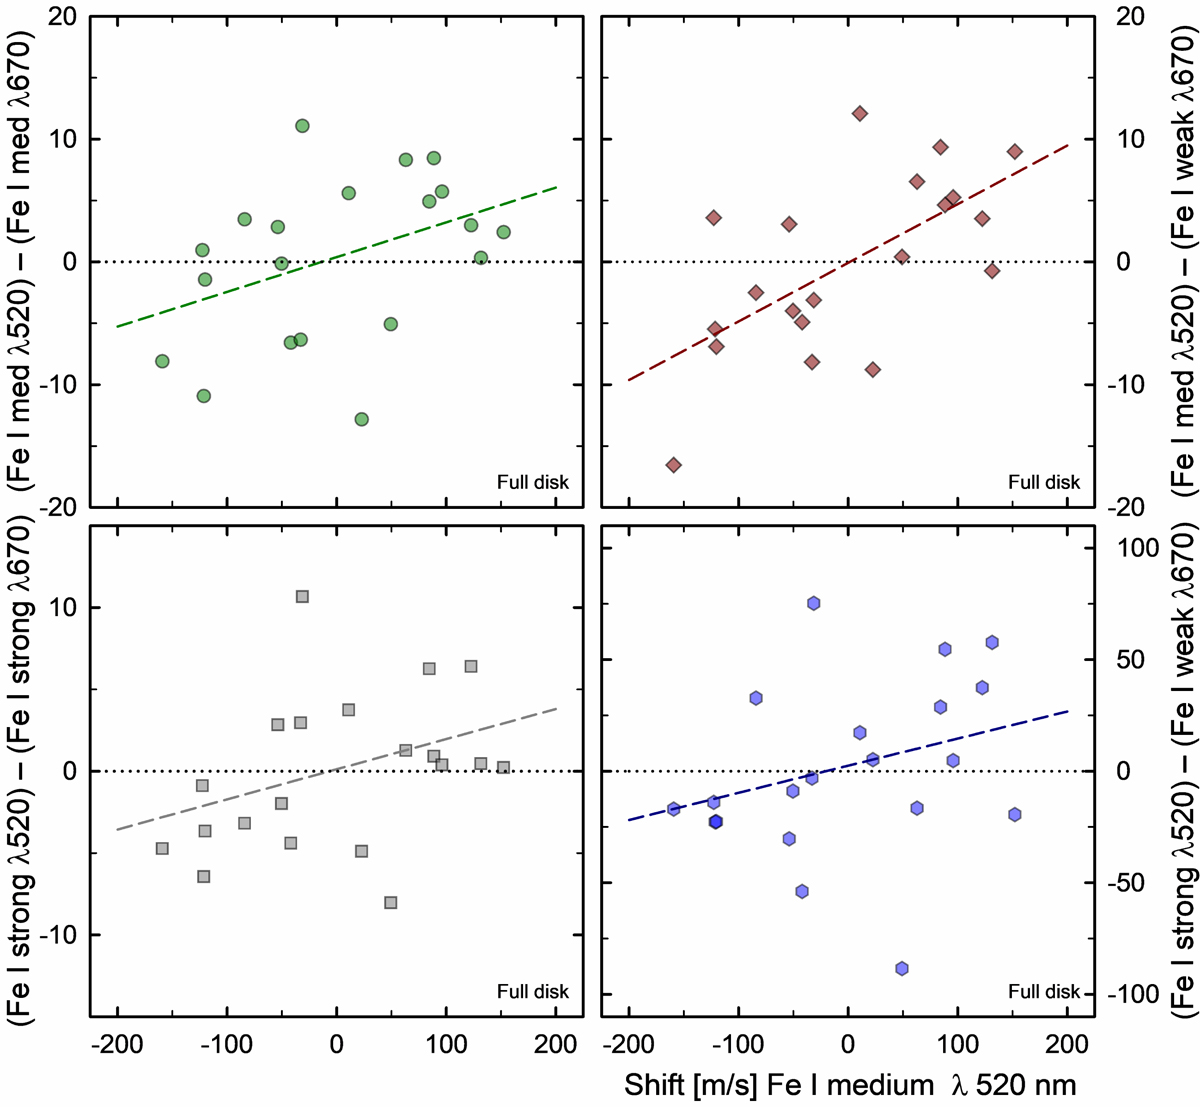
Fig. 8.
Download original image
Differences in radial-velocity shifts between Fe I lines of different strengths in different spectral regions of integrated sunlight vs. shifts in medium-strong Fe I lines at λ520 nm. Each point represents one temporal snapshot during the N59 simulation. The spectra correspond to those of a full solar disk, as synthesized from a sequence of center-to-limb spectra, although the numerical values [m s−1] refer to the small simulation area (for the actual Sun, divide by a factor of ∼150−200). The vertical scales differ among the frames. The fitted straight lines suggest the trends, but also indicate the limitation from finite simulation sequences.
Current usage metrics show cumulative count of Article Views (full-text article views including HTML views, PDF and ePub downloads, according to the available data) and Abstracts Views on Vision4Press platform.
Data correspond to usage on the plateform after 2015. The current usage metrics is available 48-96 hours after online publication and is updated daily on week days.
Initial download of the metrics may take a while.