Fig. 7.
Download original image
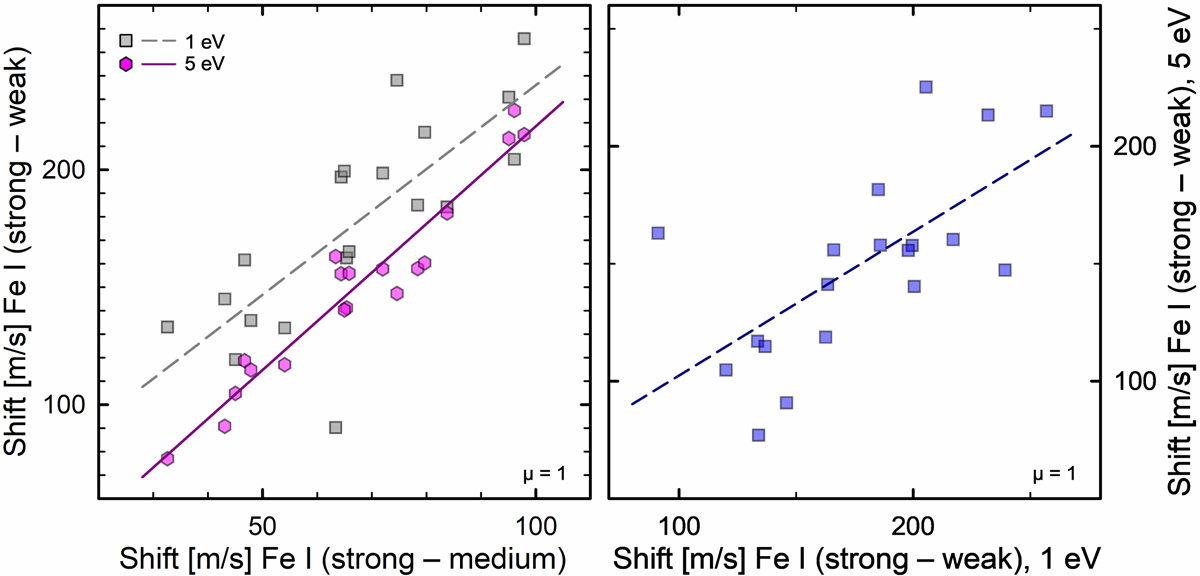
Differences in radial-velocity shifts between lines with different strengths (but similar excitation potentials). These data at μ = 1 are from synthetic isolated Fe I lines at λ620 nm in the N58 model. Each point represents the difference between instantaneous radial velocities (e.g., strong line minus weak) at one temporal snapshot during the simulation. The straight lines are fits to the data points. The different scales between the frames are adapted to reflect how convective blueshifts deviate for lines with increasingly different strengths.
Current usage metrics show cumulative count of Article Views (full-text article views including HTML views, PDF and ePub downloads, according to the available data) and Abstracts Views on Vision4Press platform.
Data correspond to usage on the plateform after 2015. The current usage metrics is available 48-96 hours after online publication and is updated daily on week days.
Initial download of the metrics may take a while.