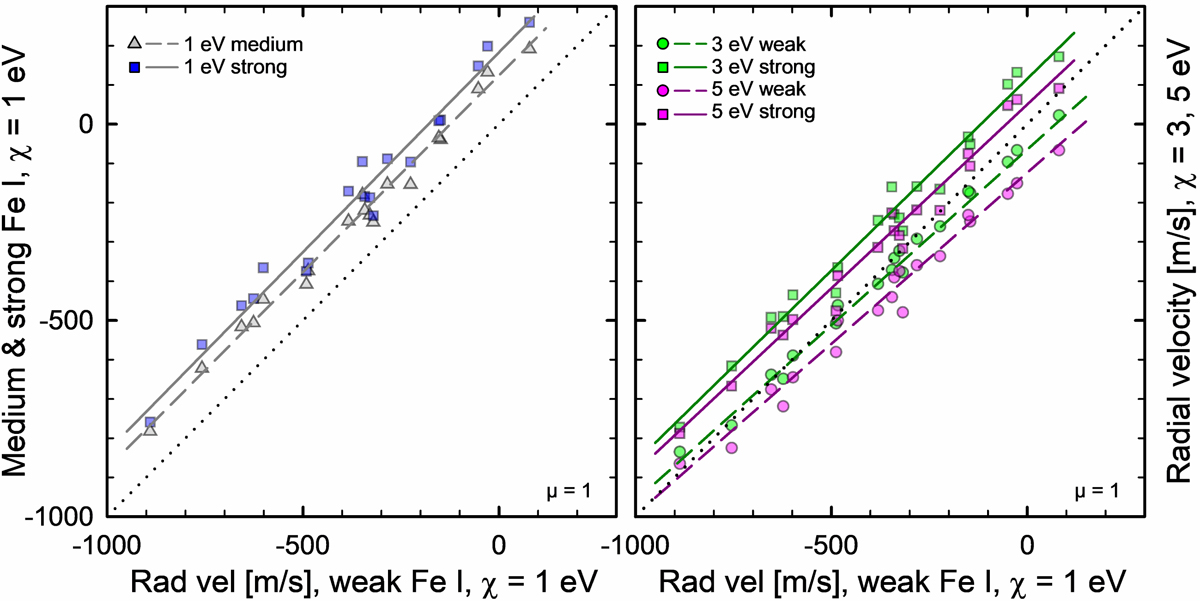
Fig. 6.
Download original image
Radial-velocity shifts of synthetic isolated Fe I lines at λ620 nm in the N58 model. Relations between shifts at solar disk center, μ = 1, for weak, medium, and strong lines are shown for different excitation potentials. Each point represents one temporal snapshot during the simulation. The dotted reference lines give the identity relations; the other fitted lines indicate how the dependence of convective blueshift on line strength and excitation potential generally remains valid, even when the spatially averaged radial velocity fluctuates.
Current usage metrics show cumulative count of Article Views (full-text article views including HTML views, PDF and ePub downloads, according to the available data) and Abstracts Views on Vision4Press platform.
Data correspond to usage on the plateform after 2015. The current usage metrics is available 48-96 hours after online publication and is updated daily on week days.
Initial download of the metrics may take a while.