Fig. 5.
Download original image
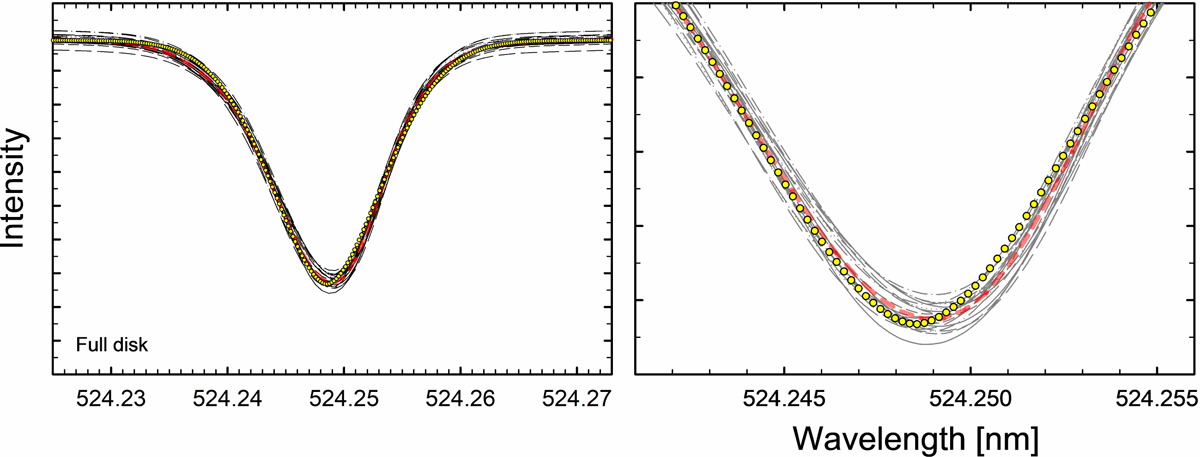
Example of a five-parameter Gaussian-type fit to a typical Fe I line profile in integrated sunlight. Profiles from each temporal snapshot are shown as thin black lines; their average is shown as a dashed red line, and the fitted profile as yellow circles. In the zoomed-in image at the right, the tick marks of the vertical scale correspond to those in the left frame.
Current usage metrics show cumulative count of Article Views (full-text article views including HTML views, PDF and ePub downloads, according to the available data) and Abstracts Views on Vision4Press platform.
Data correspond to usage on the plateform after 2015. The current usage metrics is available 48-96 hours after online publication and is updated daily on week days.
Initial download of the metrics may take a while.