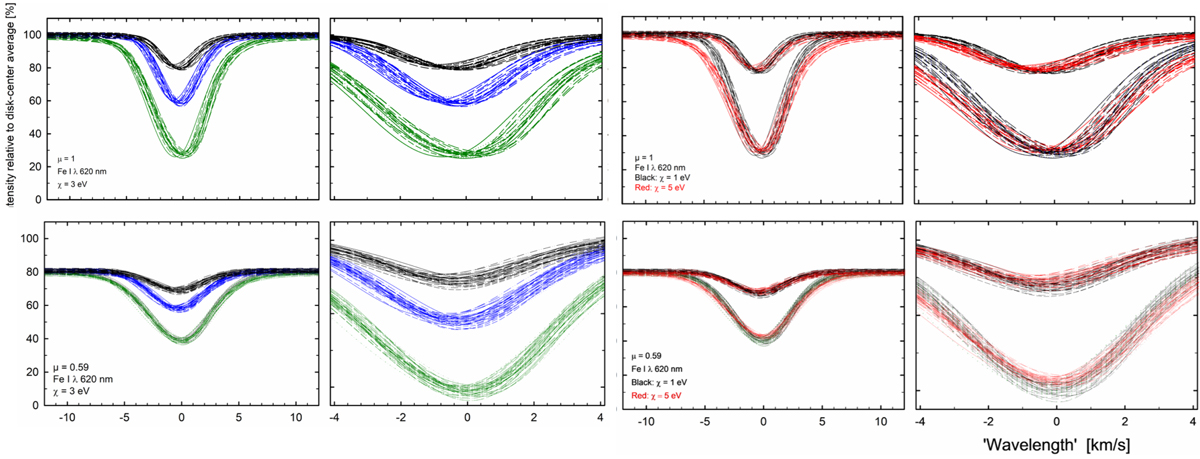
Fig. 4.
Download original image
Temporal variability of idealized line profiles during the N58 simulation sequence, sampled at 19 instances of time. Left columns: differently strong Fe I lines at λ620 nm, χ = 3 eV; right columns: lines of similar strength, but with different lower excitation potentials, χ = 1 eV (black) and 5 eV (red). Top row: profiles at disk center μ = 1; bottom row: μ = 0.59. To limit cluttering, profiles are shown for only two (orthogonal) azimuth angles. The right frames show zoomed-in images of the line centers, with wavelength scales equal to those in Fig. 3; the tick marks on the vertical axes correspond to those for the full profiles.
Current usage metrics show cumulative count of Article Views (full-text article views including HTML views, PDF and ePub downloads, according to the available data) and Abstracts Views on Vision4Press platform.
Data correspond to usage on the plateform after 2015. The current usage metrics is available 48-96 hours after online publication and is updated daily on week days.
Initial download of the metrics may take a while.