Fig. 3.
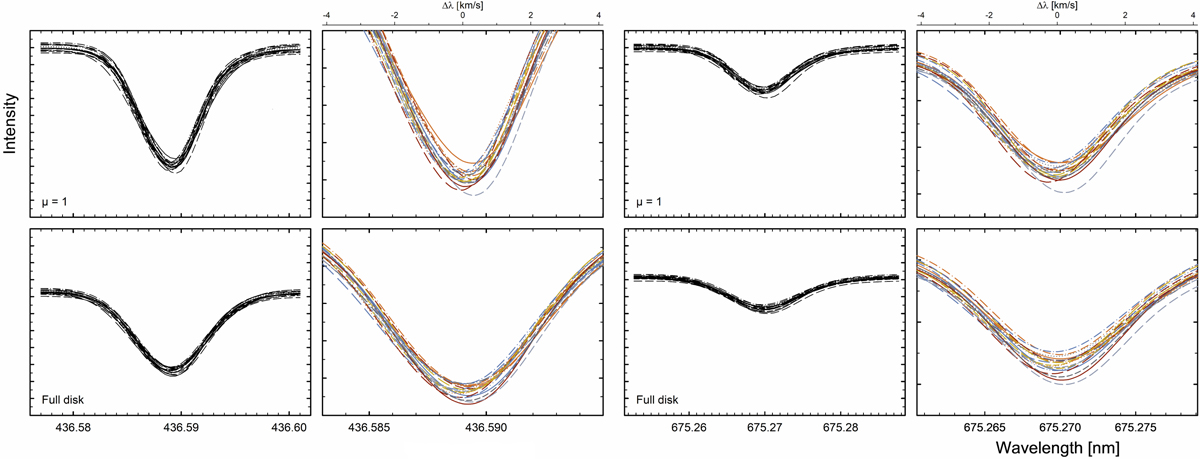
Download original image
Example of temporal variability of line profiles during the N59 simulation sequence, sampled at 20 instances of time. Left columns: strong Fe Iλ436.59 nm, χ = 2.99 eV line (in the shortward blue); right columns: weak Fe Iλ675.27 nm, χ = 4.64 eV line (in the longward red). The upper row shows profiles for the disk center μ = 1; the bottom row shows integrated sunlight, corresponding to a full solar disk, synthesized using center-to-limb profiles from the small simulation area. The magnified images on the right show the line centers on a uniform wavelength scale in units of radial velocity (top); the tick marks on the vertical axes correspond to those for the full profiles.
Current usage metrics show cumulative count of Article Views (full-text article views including HTML views, PDF and ePub downloads, according to the available data) and Abstracts Views on Vision4Press platform.
Data correspond to usage on the plateform after 2015. The current usage metrics is available 48-96 hours after online publication and is updated daily on week days.
Initial download of the metrics may take a while.