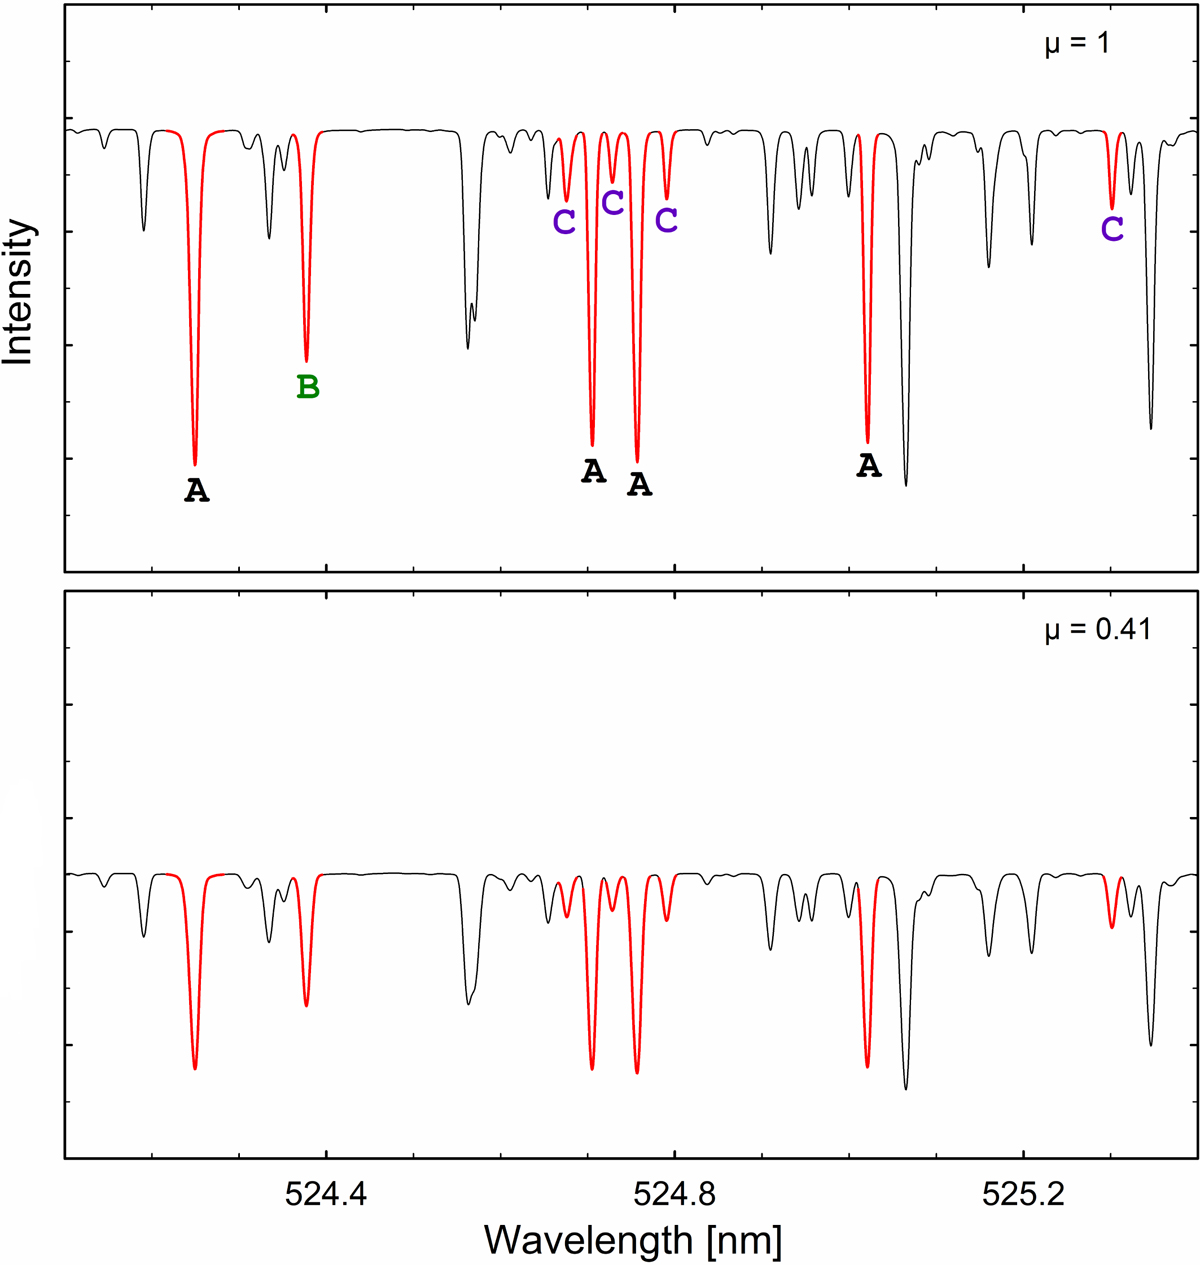
Fig. 2.
Download original image
Examples of selected lines. Shown here are Fe I lines around λ525 nm from the N59 model. Top: synthetic spectra at solar disk center, μ = 1; bottom: μ = 0.41. The clean lines selected for detailed analysis are shown in red: strong, medium, and weak labeled A, B, and C, respectively. The lines become noticeably broader toward the limb.
Current usage metrics show cumulative count of Article Views (full-text article views including HTML views, PDF and ePub downloads, according to the available data) and Abstracts Views on Vision4Press platform.
Data correspond to usage on the plateform after 2015. The current usage metrics is available 48-96 hours after online publication and is updated daily on week days.
Initial download of the metrics may take a while.