Fig. 14.
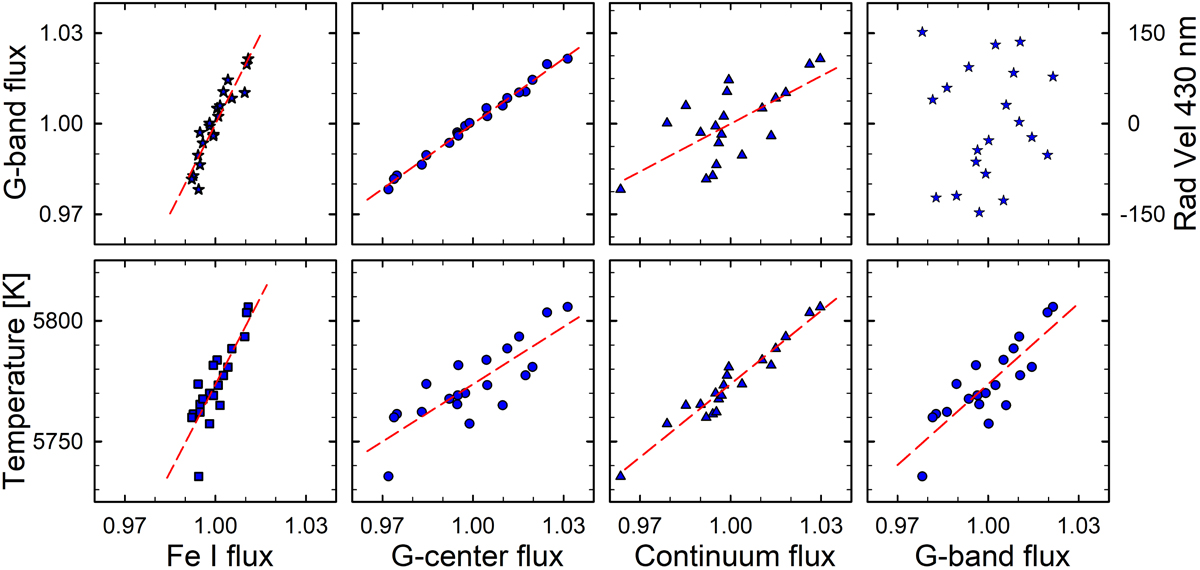
Download original image
Temporal flickering of the flux in the G-band region of synthetic nonmagnetic CO 5BOLD N59 solar spectra, measured at μ = 0.79. The lower row shows how the effective temperature of the model area at each selected time of the simulation affects features in the region. The G-band flux is plotted in the three leftmost upper frames; the rightmost frame shows radial velocities for the full disk measured in the nearby Fe I lines surrounding the G-band.
Current usage metrics show cumulative count of Article Views (full-text article views including HTML views, PDF and ePub downloads, according to the available data) and Abstracts Views on Vision4Press platform.
Data correspond to usage on the plateform after 2015. The current usage metrics is available 48-96 hours after online publication and is updated daily on week days.
Initial download of the metrics may take a while.