Fig. 13.
Download original image
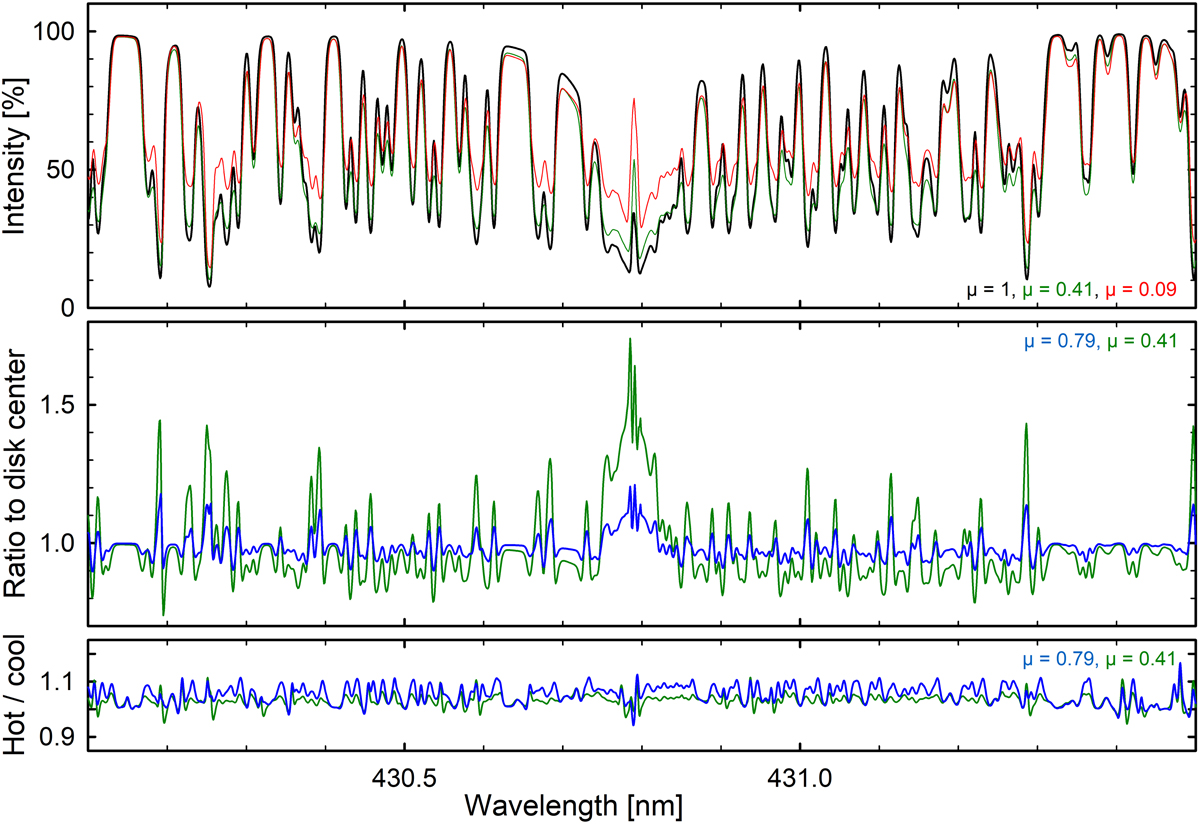
G-band region in synthetic nonmagnetic CO 5BOLD N59 solar spectra. Top frame: intensity spectra at disk center μ = 1 (black), at μ = 0.41 (green), and close to limb μ = 0.09 (red), separately normalized to a very local continuum. Middle frame: spectral ratios relative to disk center for μ = 0.79 (blue) and μ = 0.41 (green). Bottom frame: range of temporal variability illustrated by spectral ratios between snapshot instances of the highest (5806 K) and lowest (5735 K) model temperatures; the same vertical scale as the middle frame is used.
Current usage metrics show cumulative count of Article Views (full-text article views including HTML views, PDF and ePub downloads, according to the available data) and Abstracts Views on Vision4Press platform.
Data correspond to usage on the plateform after 2015. The current usage metrics is available 48-96 hours after online publication and is updated daily on week days.
Initial download of the metrics may take a while.