Open Access
Fig. 12.
Download original image
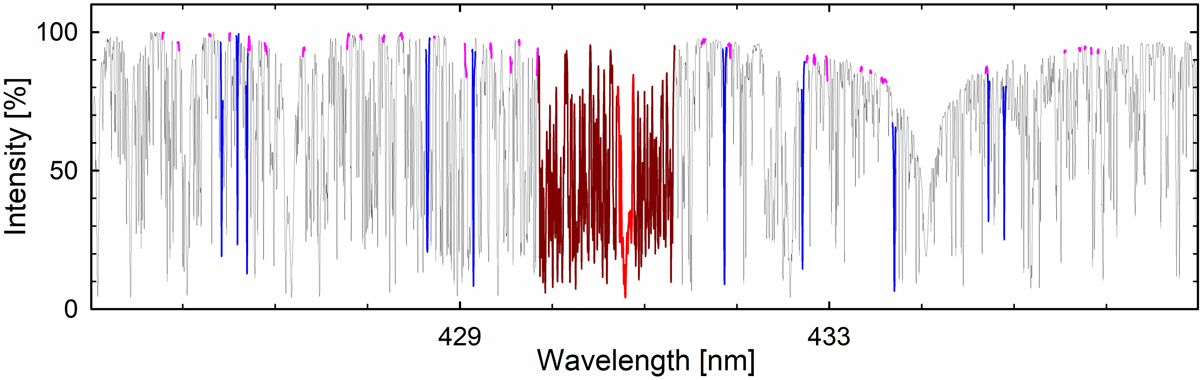
Spectral region surrounding the G-band, indicating measured sections: G-band core (red), full G-band (red + brown), nearby Fe I lines (blue), and pseudocontinuum reference points (red). This plot from the CO 5BOLD N59 model is for the disk center, μ = 1.
Current usage metrics show cumulative count of Article Views (full-text article views including HTML views, PDF and ePub downloads, according to the available data) and Abstracts Views on Vision4Press platform.
Data correspond to usage on the plateform after 2015. The current usage metrics is available 48-96 hours after online publication and is updated daily on week days.
Initial download of the metrics may take a while.