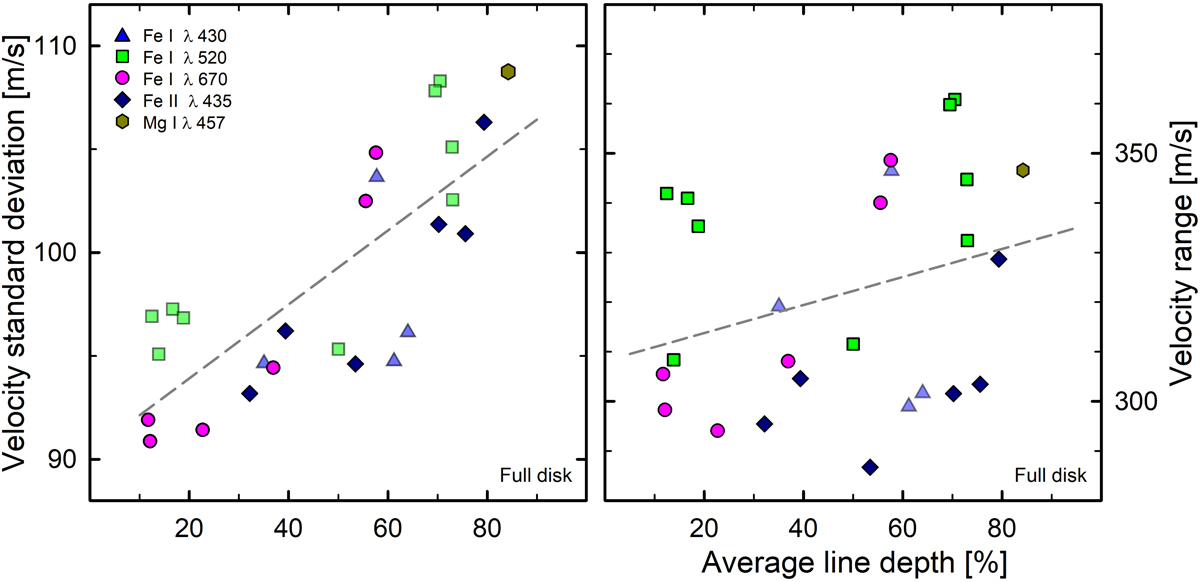
Fig. 11.
Download original image
Radial-velocity fluctuations among different line groups, as a function of absorption-line depth. Standard deviations and jittering ranges in the simulation of integrated sunlight are shown, with numbers from the small simulation area (for the actual Sun, divide by a factor of ∼150−200). Stronger and deeper lines display greater amplitudes. The trends extend to the even stronger Na I D1 line which, at 136 and 404 m s−1, is off scale and not included for the fitting of the lines.
Current usage metrics show cumulative count of Article Views (full-text article views including HTML views, PDF and ePub downloads, according to the available data) and Abstracts Views on Vision4Press platform.
Data correspond to usage on the plateform after 2015. The current usage metrics is available 48-96 hours after online publication and is updated daily on week days.
Initial download of the metrics may take a while.