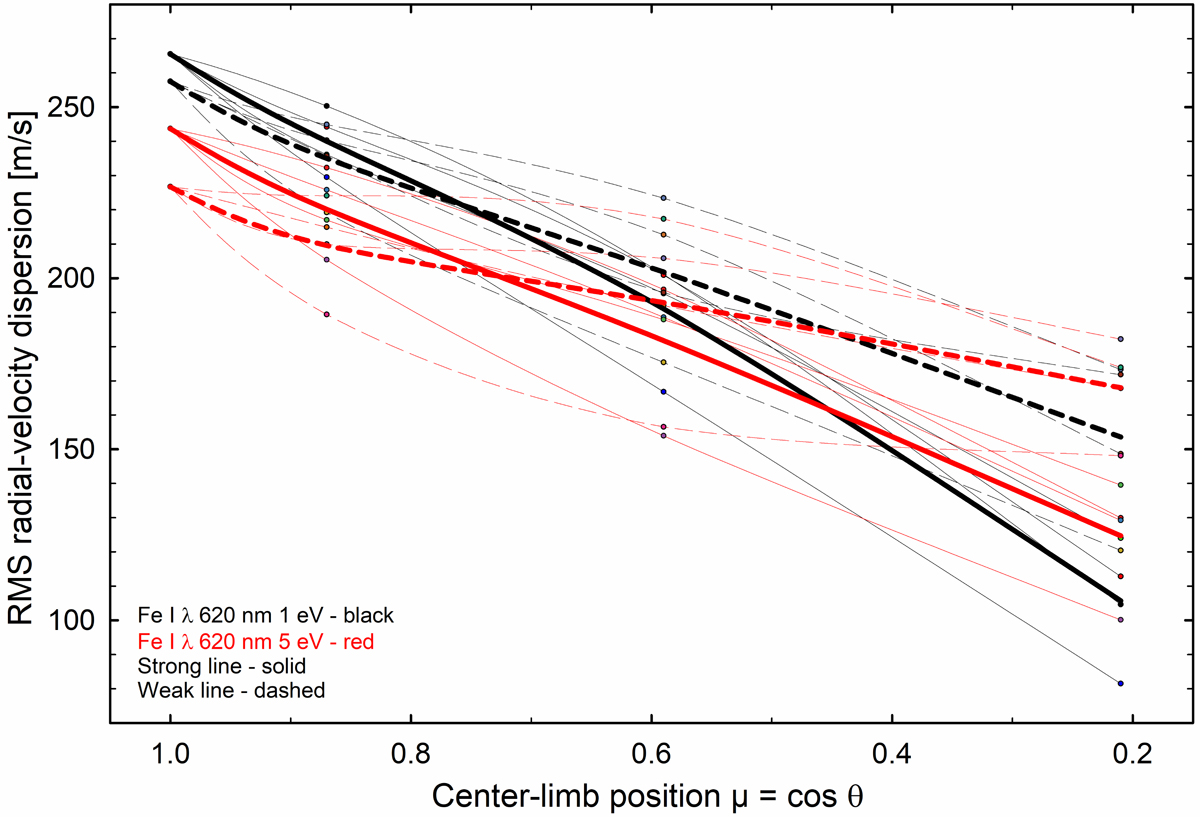
Fig. 10.
Download original image
Spatially resolved jittering across the solar disk. RMS values for radial velocities of idealized Fe I lines at λ620 nm are shown for lines of different strengths at excitation potentials χ = 1 and 5 eV. The bold curves show averages over the small simulation area: solid for strong lines; dashed for weak. The curves for χ = 1 eV are black and for 5 eV are red. Multiple thin lines illustrate the differences among different azimuth angles at each center-limb position.
Current usage metrics show cumulative count of Article Views (full-text article views including HTML views, PDF and ePub downloads, according to the available data) and Abstracts Views on Vision4Press platform.
Data correspond to usage on the plateform after 2015. The current usage metrics is available 48-96 hours after online publication and is updated daily on week days.
Initial download of the metrics may take a while.