Fig. 1.
Download original image
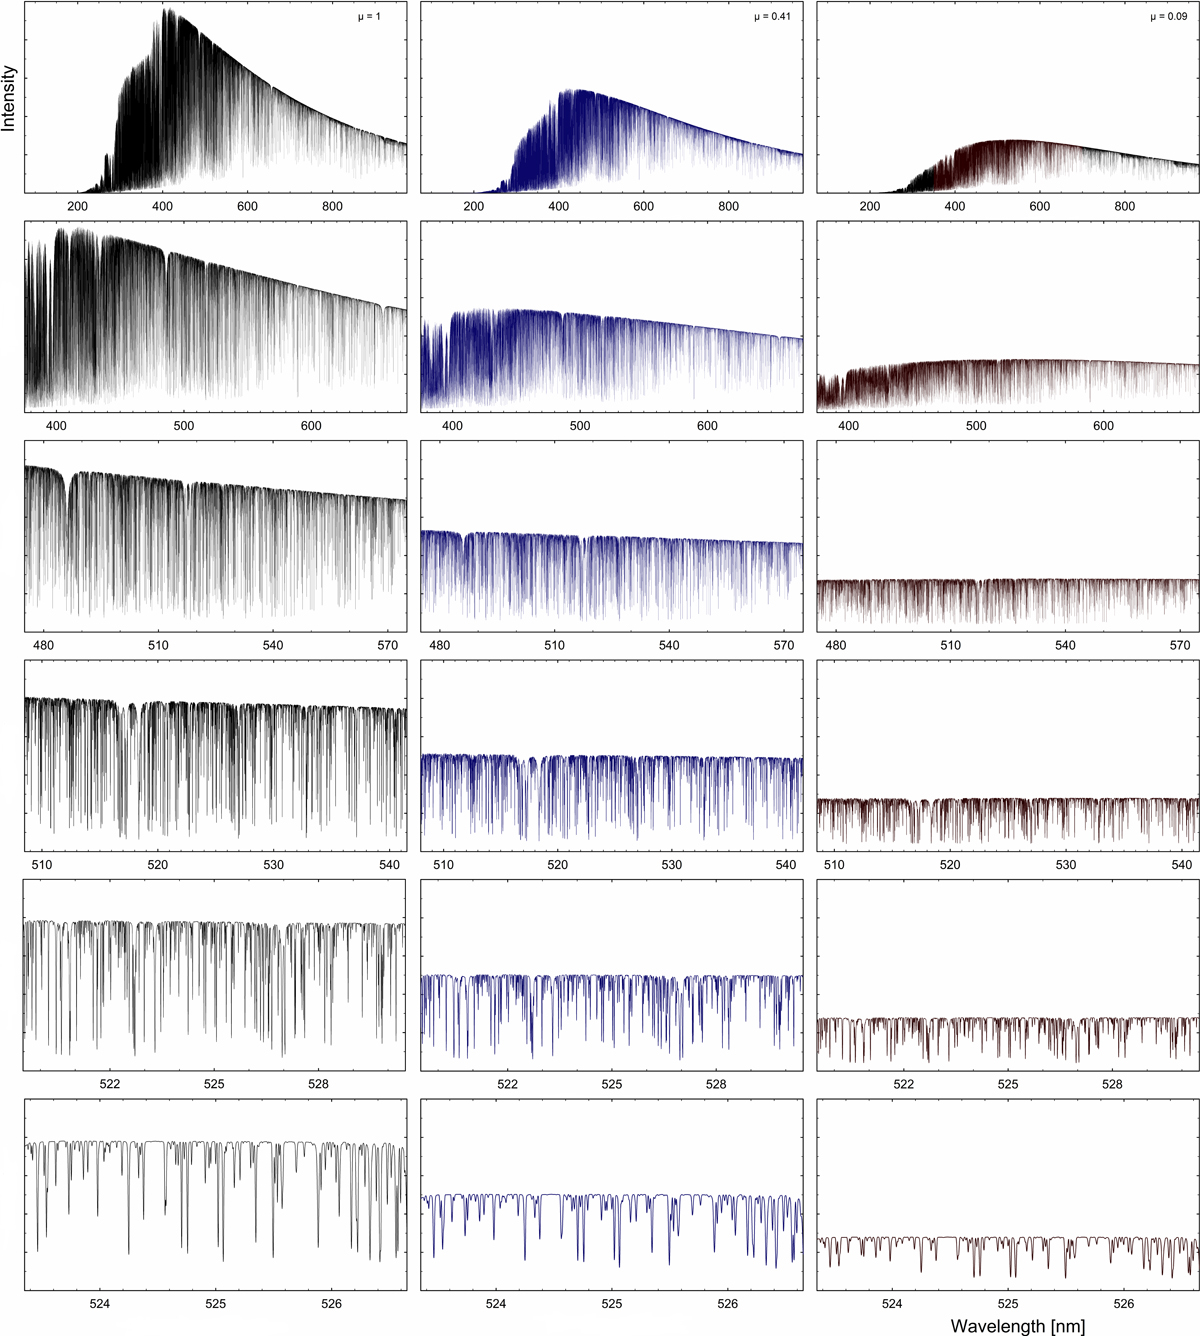
Synthetic solar spectra from the CO 5BOLD N59 model simulation, centered on 525 nm. The spectra are seen over gradually narrower wavelength ranges, decreasing by a factor of 3 for each row from top down. Left column: disk center: μ = cos θ = 1; middle: μ = 0.41; right: μ = 0.09. The intensity scale is common for all frames, and illustrates how the limb darkening is more pronounced at shorter wavelengths.
Current usage metrics show cumulative count of Article Views (full-text article views including HTML views, PDF and ePub downloads, according to the available data) and Abstracts Views on Vision4Press platform.
Data correspond to usage on the plateform after 2015. The current usage metrics is available 48-96 hours after online publication and is updated daily on week days.
Initial download of the metrics may take a while.