Fig. 9
Download original image
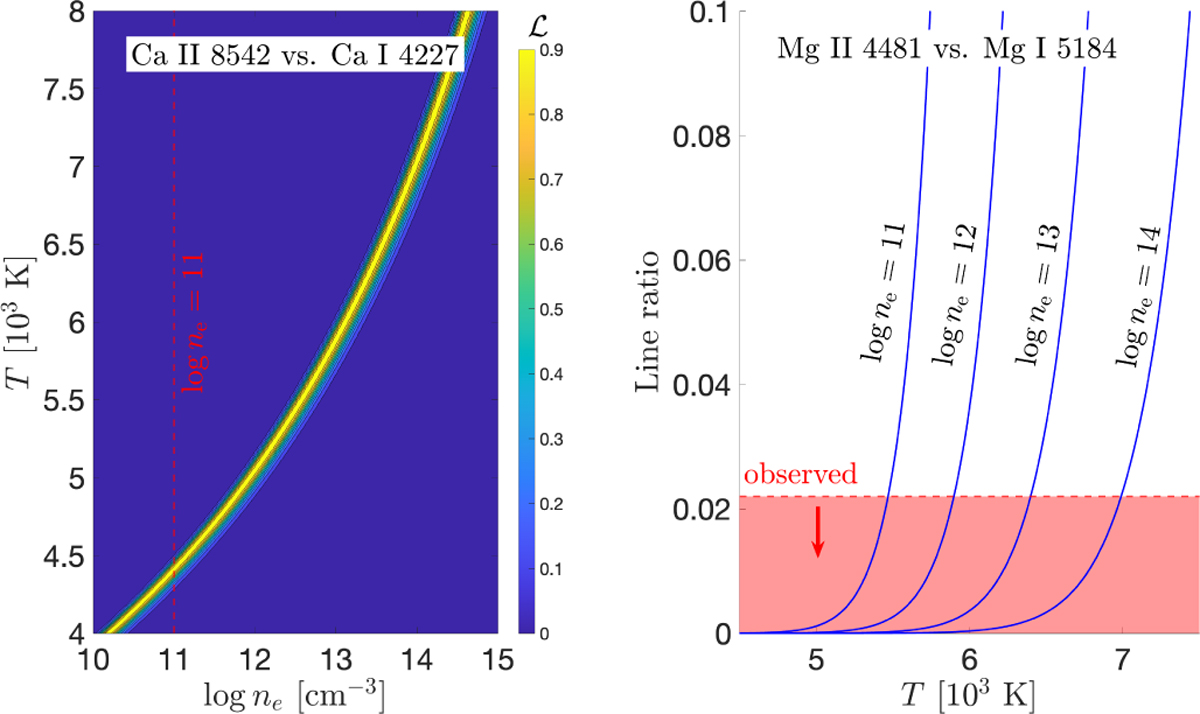
Result of the Saha-Boltzmann analysis for Ca and Mg. Observed line ratios were computed from the epoch 2 ESPRESSO spectrum. Left panel: likelihood for the observed Ca II 8542 vs. Ca I 4227 ratio as a function of log ne and T. Right panel: theoretical Mg II 4481 vs. Mg I 5184 ratios as a function of T for log ne [cm−3] = 11,12,13,14. The red area marks the upper limit on the observed ratio.
Current usage metrics show cumulative count of Article Views (full-text article views including HTML views, PDF and ePub downloads, according to the available data) and Abstracts Views on Vision4Press platform.
Data correspond to usage on the plateform after 2015. The current usage metrics is available 48-96 hours after online publication and is updated daily on week days.
Initial download of the metrics may take a while.