Fig. 7
Download original image
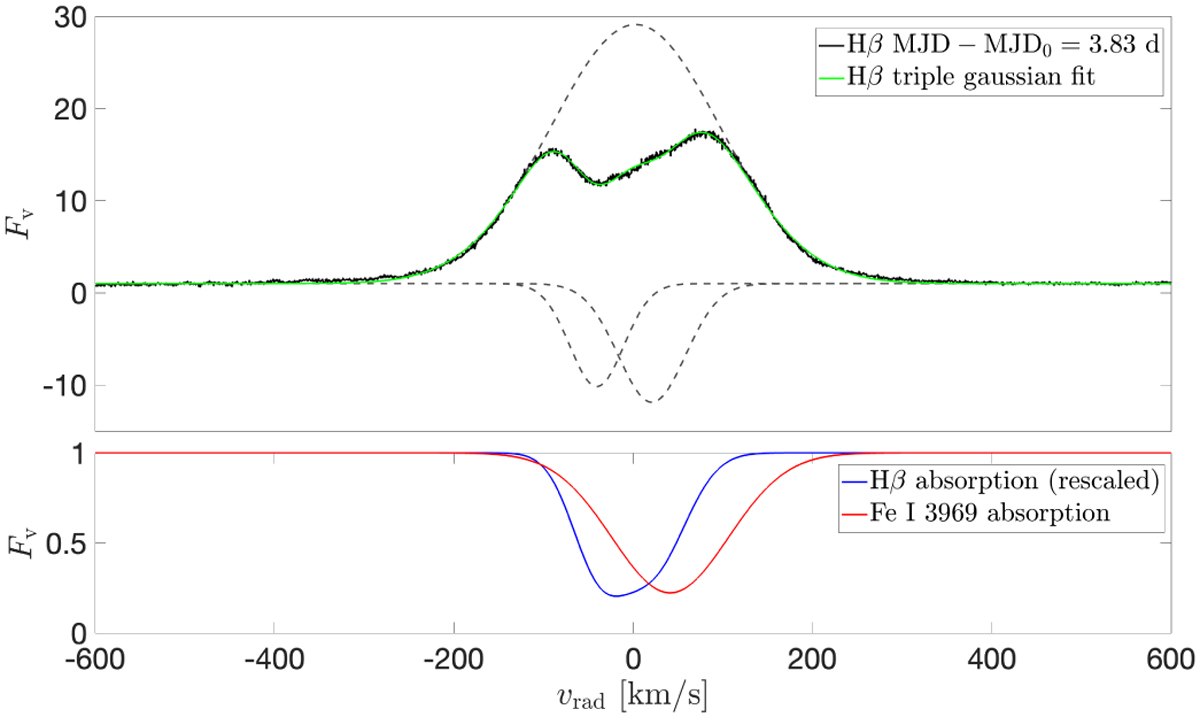
Comparison between the Hβ and Fe I 3969 absorption components. Top panel: triple Gaussian fit of the continuum normalized Hβ line in the epoch 2 ESPRESSO spectrum. The dashed lines show the three Gaussian components. Bottom panel: COMPARISON between the continuum normalized absorption profiles in Hβ and Fe I 3969. The red line is the Gaussian best fit of the Fe I 3969 from Fig. 6. The blue line is the sum of the two Gaussian absorption components in Hβ, rescaled relative to the continuum to allow the comparison with the Fe I 3969 absorption profile.
Current usage metrics show cumulative count of Article Views (full-text article views including HTML views, PDF and ePub downloads, according to the available data) and Abstracts Views on Vision4Press platform.
Data correspond to usage on the plateform after 2015. The current usage metrics is available 48-96 hours after online publication and is updated daily on week days.
Initial download of the metrics may take a while.