Fig. 6
Download original image
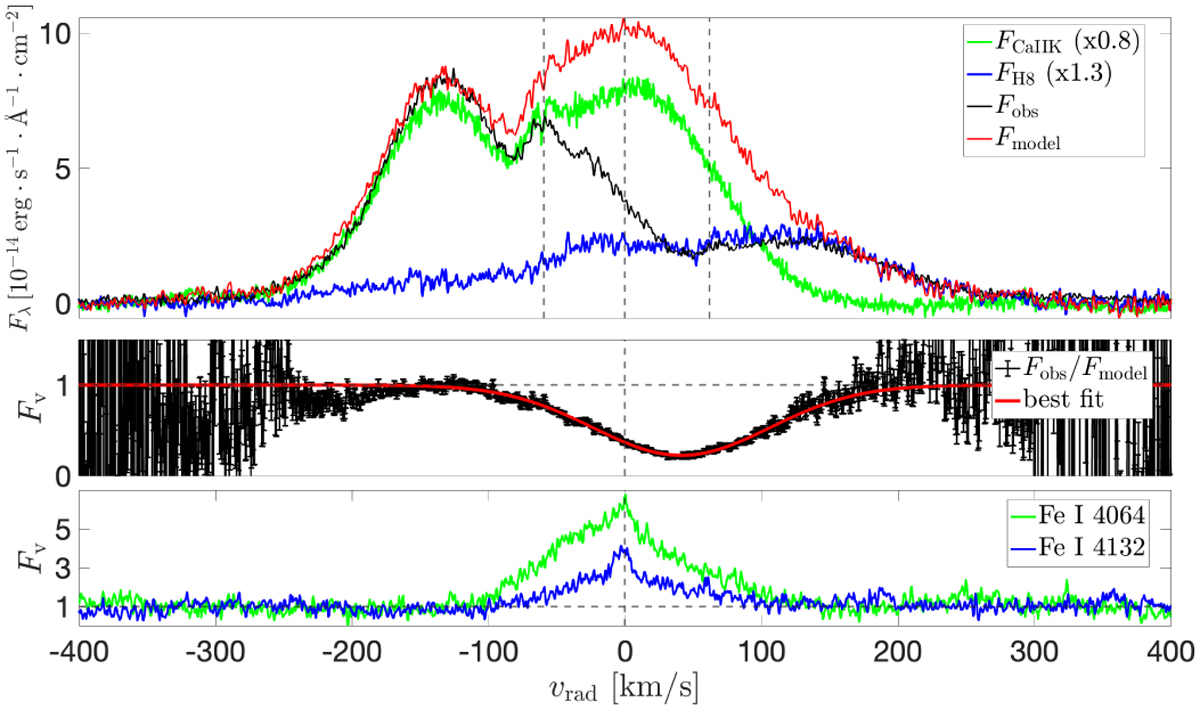
Reconstruction of the Fe I absorption. All profiles are from the epoch 2 ESPRESSO spectrum. All lines are plotted relative to the rest wavelength of Fe I 3969. The top panel shows the continuum subtracted profile of the Ca II H + Hϵ blend (black) compared to the Ca II K (green) and H8 (blue) lines. The red line is the model for the unabsorbed blend (Eq. (2)). The vertical dashed lines indicate the velocity displacement of Ca II H, Fe I 3969 and Hϵ relative to the rest wavelength of Fe I 3969. The middle panel shows the Fe I 3969 absorption profile, reconstructed as explained in Sect. 4.2, and its best fit. The bottom panel shows the Fe I 4064 and 4132 emission lines.
Current usage metrics show cumulative count of Article Views (full-text article views including HTML views, PDF and ePub downloads, according to the available data) and Abstracts Views on Vision4Press platform.
Data correspond to usage on the plateform after 2015. The current usage metrics is available 48-96 hours after online publication and is updated daily on week days.
Initial download of the metrics may take a while.