Open Access
Fig. 3
Download original image
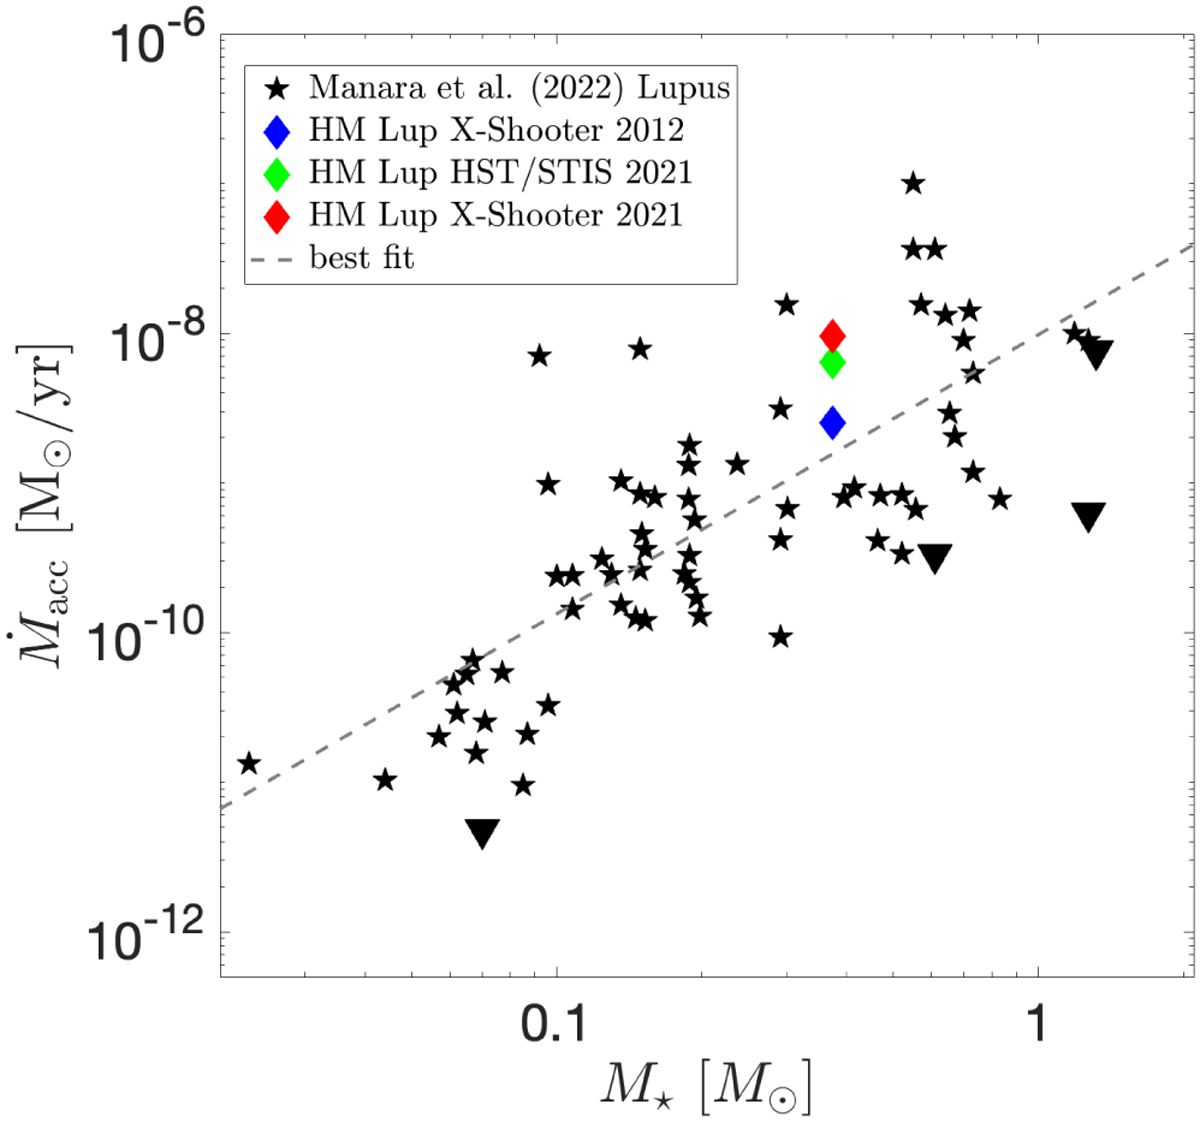
Ṁacc-M★ diagram for X-shooter targets in Lupus, using the values from Manara et al. (2023). The black triangles indicate upper limits on the measured accretion rate. The blue, green and red diamonds mark the accretion rate of HM Lup in 2012 and 2021 (Sect. 5.2). The dashed gray line is a linear best fit to the data.
Current usage metrics show cumulative count of Article Views (full-text article views including HTML views, PDF and ePub downloads, according to the available data) and Abstracts Views on Vision4Press platform.
Data correspond to usage on the plateform after 2015. The current usage metrics is available 48-96 hours after online publication and is updated daily on week days.
Initial download of the metrics may take a while.