Fig. 12
Download original image
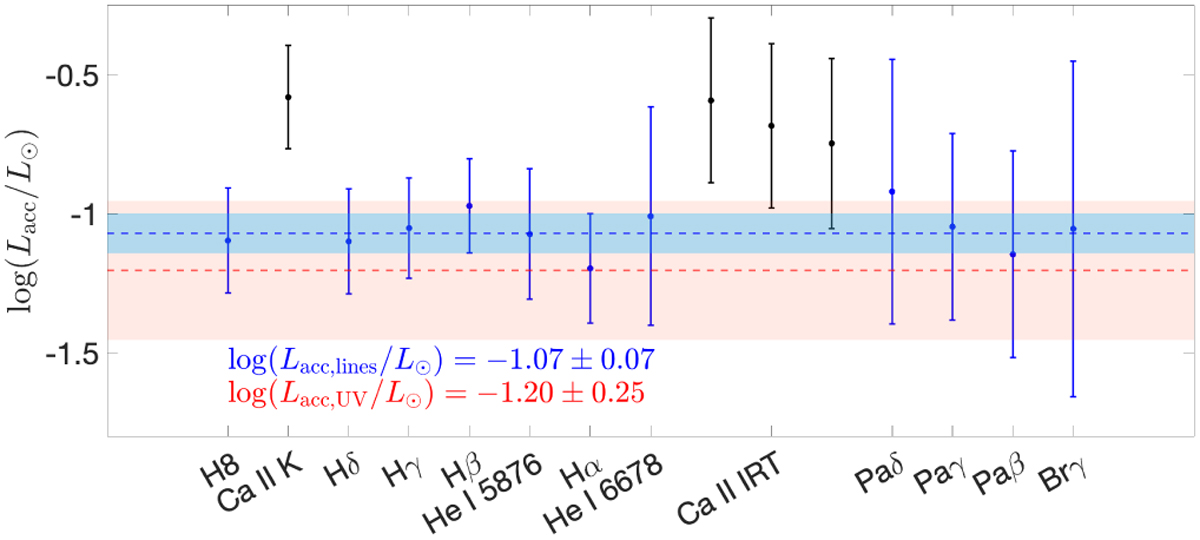
Comparison between the accretion luminosity derived from emission lines and that derived from the UV excess in the 2021 X-shooter spectrum. Lacc,UV and its uncertainty are displayed with the red dashed line and the red shaded area. The blue dashed line and the blue shaded area are the value of Lacc,lines and its uncertainty, obtained from a weighted average of the line values. The lines marked in black were excluded from the calculation of the average.
Current usage metrics show cumulative count of Article Views (full-text article views including HTML views, PDF and ePub downloads, according to the available data) and Abstracts Views on Vision4Press platform.
Data correspond to usage on the plateform after 2015. The current usage metrics is available 48-96 hours after online publication and is updated daily on week days.
Initial download of the metrics may take a while.