Fig. 10
Download original image
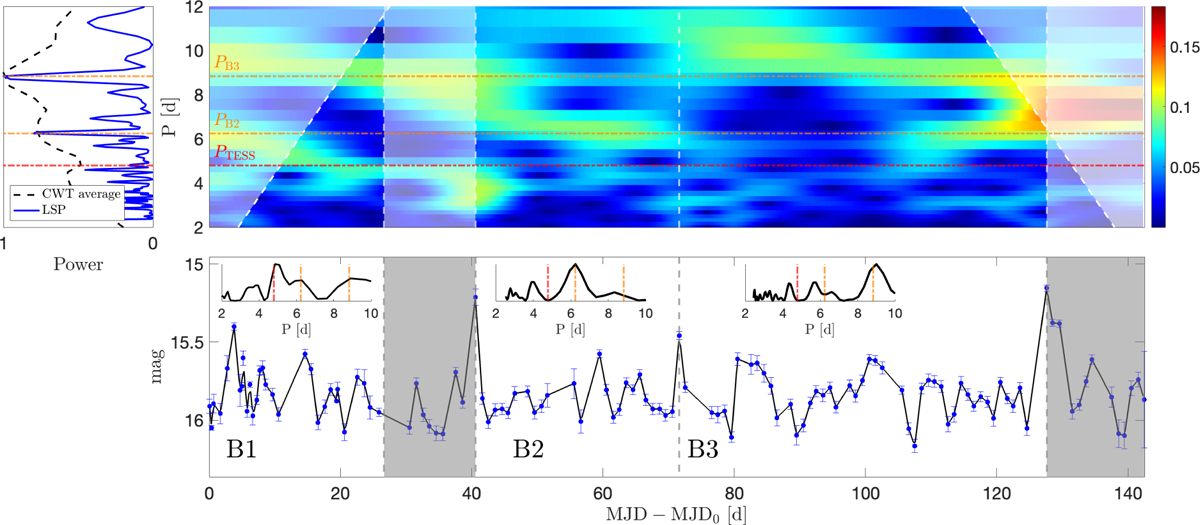
Continuous wavelet analysis of the AAVSO B band photometry. The top panel shows the CWT. The inset on the left displays the LSP of the whole dataset, together with a temporal average of the CWT. The orange horizontal dot-dashed lines mark the periods obtained from the LSP analysis, i.e., PB2 = 6.24 days and PB3 = 8.84 day, while the red one indicates the 2021 TESS period, PTESS = 4.79 days. The bottom panel displays the AAVSO B band light curve and its linear interpolation. The insets show the LSP for three different time segments. We excluded the shaded areas from the calculation of the LSPs to highlight the different timescales detected.
Current usage metrics show cumulative count of Article Views (full-text article views including HTML views, PDF and ePub downloads, according to the available data) and Abstracts Views on Vision4Press platform.
Data correspond to usage on the plateform after 2015. The current usage metrics is available 48-96 hours after online publication and is updated daily on week days.
Initial download of the metrics may take a while.