Fig. 1
Download original image
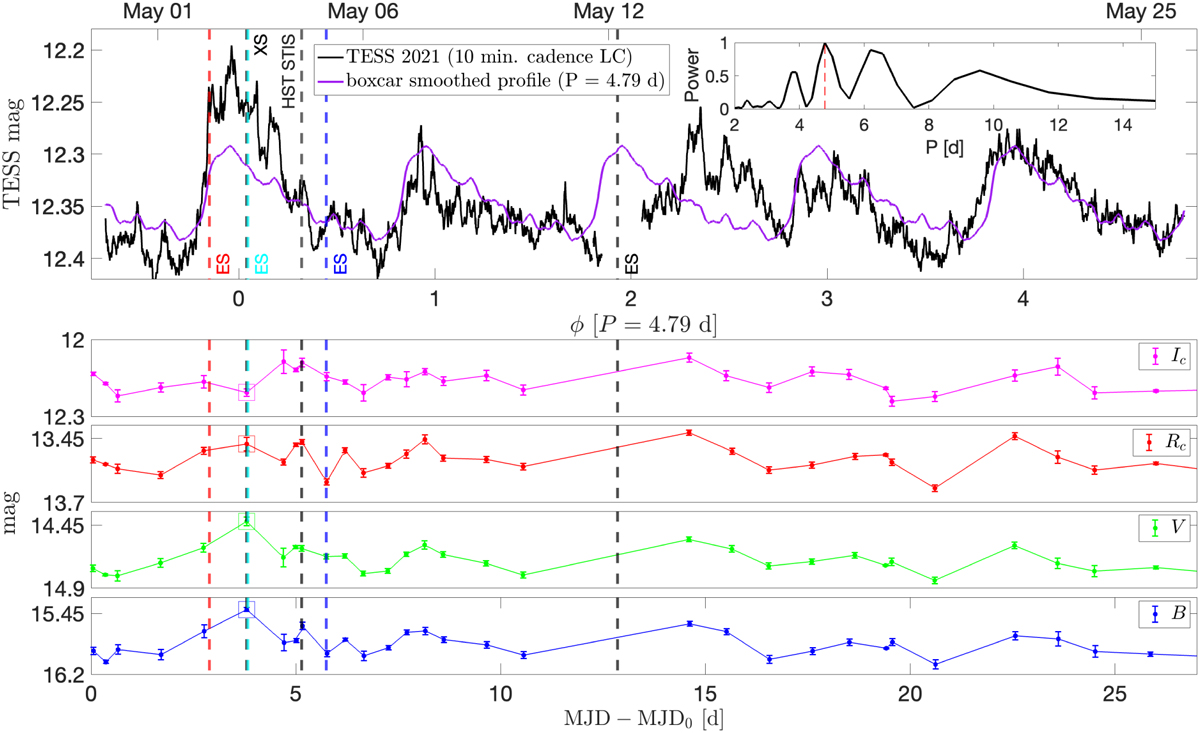
Light curves and timing of simultaneous spectroscopy for HM Lup. The topmost panel shows the 2021 10 minute cadence TESS light curve (Sector 38). The inset displays the Lomb–Scargle Periodogram for the TESS light curve. Overlaid in purple is a boxcar smoothed version of the light curve produced by phase-folding the data with the period of the highest peak in the Lomb–Scargle periodogram, 4.79 day. The phase ϕ was computed with this period and ϕ = 0 at the maximum of the TESS light curve, MJD 59 336.97. The vertical dashed lines mark the epochs of the simultaneous spectroscopic observations. Here ES = ESPRESSO and XS = X-shooter. The other panels show the part of the AAVSO BVRcIc photometry that is simultaneous with TESS, with a linear interpolation as a guideline. The large open squares mark the synthetic photometry obtained from the X-shooter spectrum for the four filters. We defined MJD0 = 59 333.363 as the beginning of TESS Sector 38 observation.
Current usage metrics show cumulative count of Article Views (full-text article views including HTML views, PDF and ePub downloads, according to the available data) and Abstracts Views on Vision4Press platform.
Data correspond to usage on the plateform after 2015. The current usage metrics is available 48-96 hours after online publication and is updated daily on week days.
Initial download of the metrics may take a while.