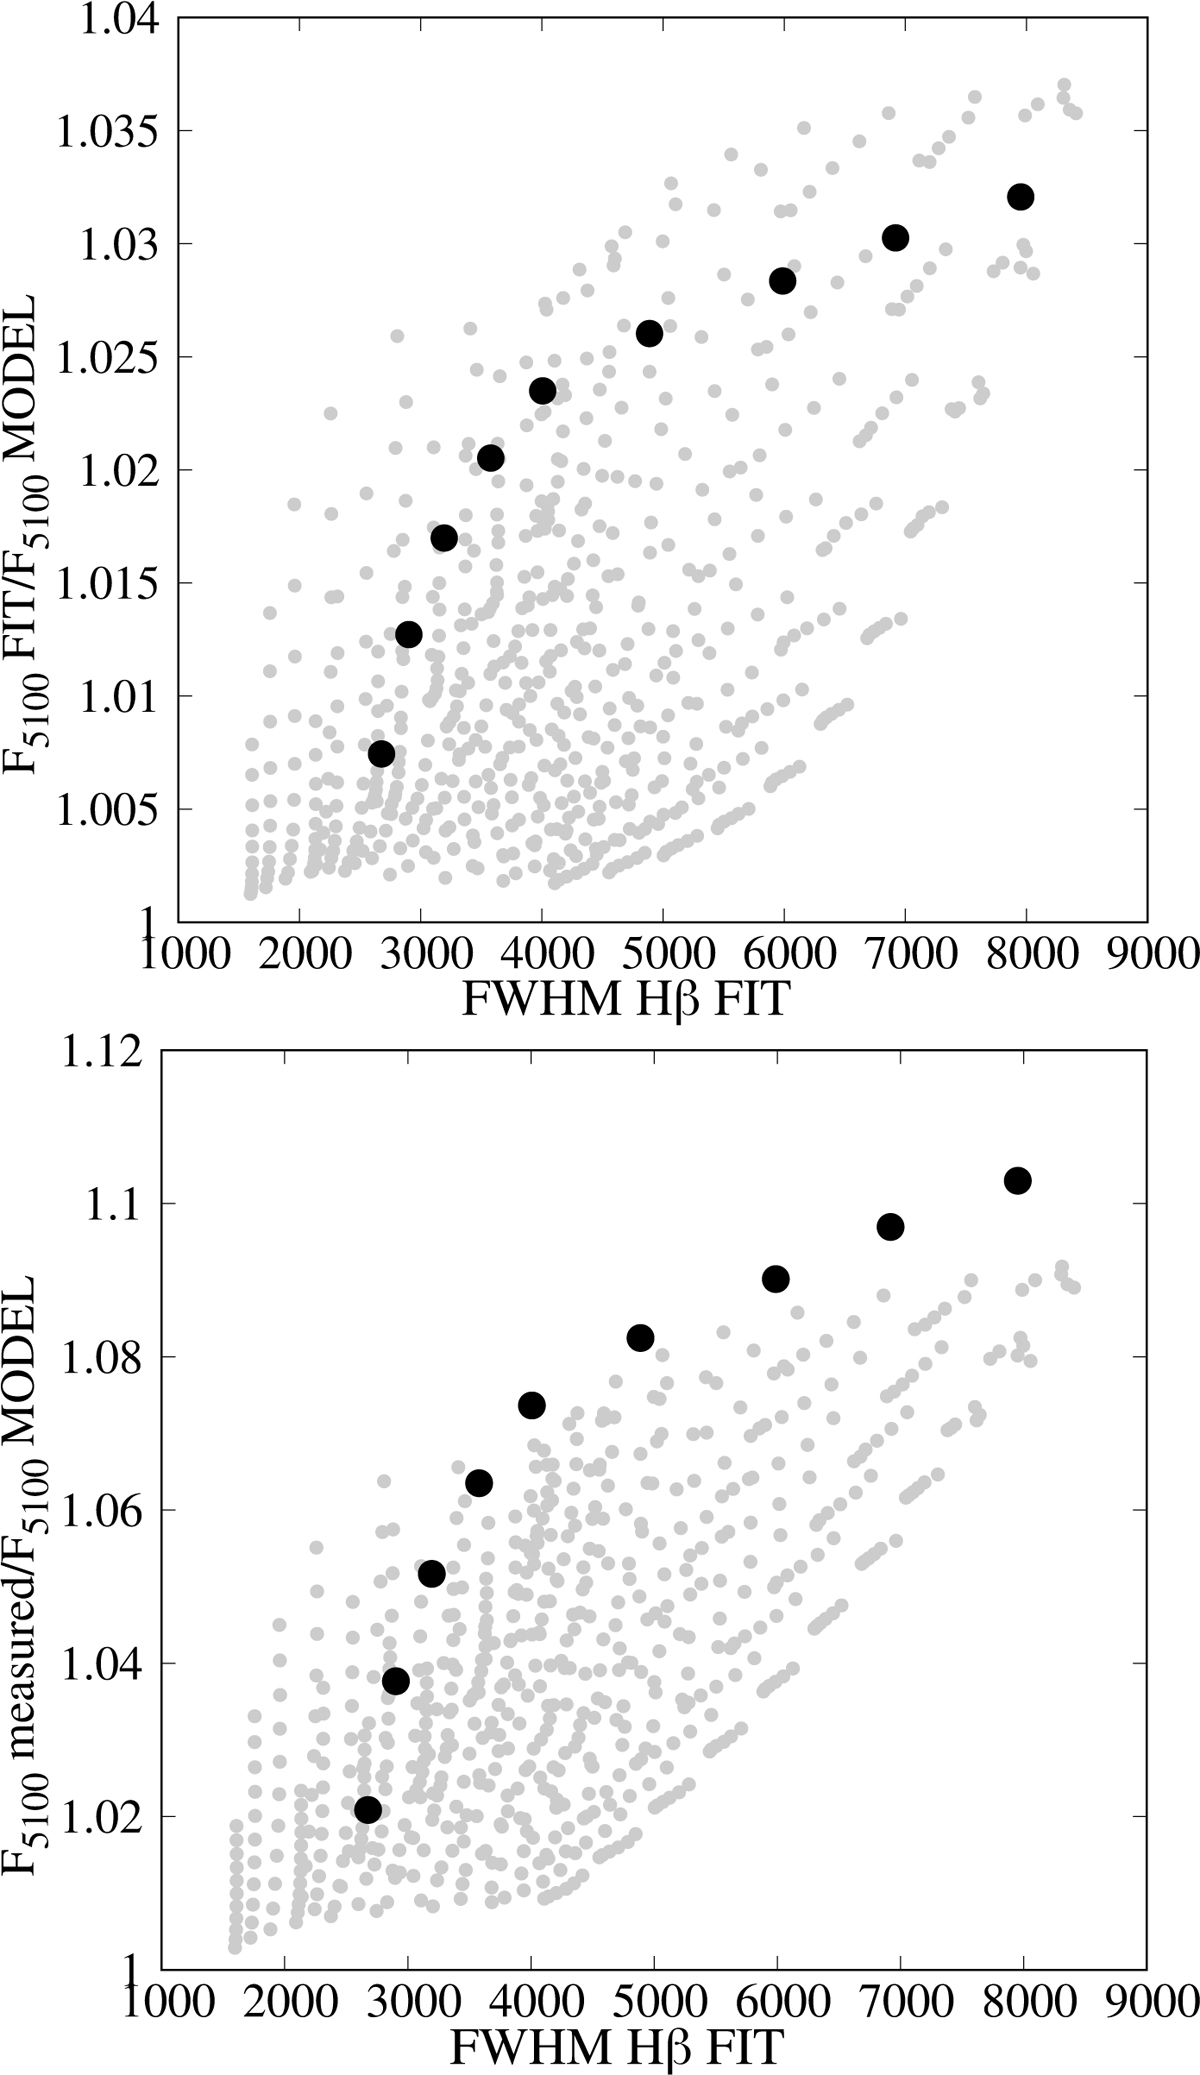
Fig. 9.
Download original image
Comparison between continuum flux at 5100 Å from the model and obtained from the best fit of the power law (top) along with same, but for the continuum flux measured at 5100 Å (bottom). The black dots are values obtained from the initial set of model spectra, while the grey dots are values obtained from the large sample of model spectra.
Current usage metrics show cumulative count of Article Views (full-text article views including HTML views, PDF and ePub downloads, according to the available data) and Abstracts Views on Vision4Press platform.
Data correspond to usage on the plateform after 2015. The current usage metrics is available 48-96 hours after online publication and is updated daily on week days.
Initial download of the metrics may take a while.