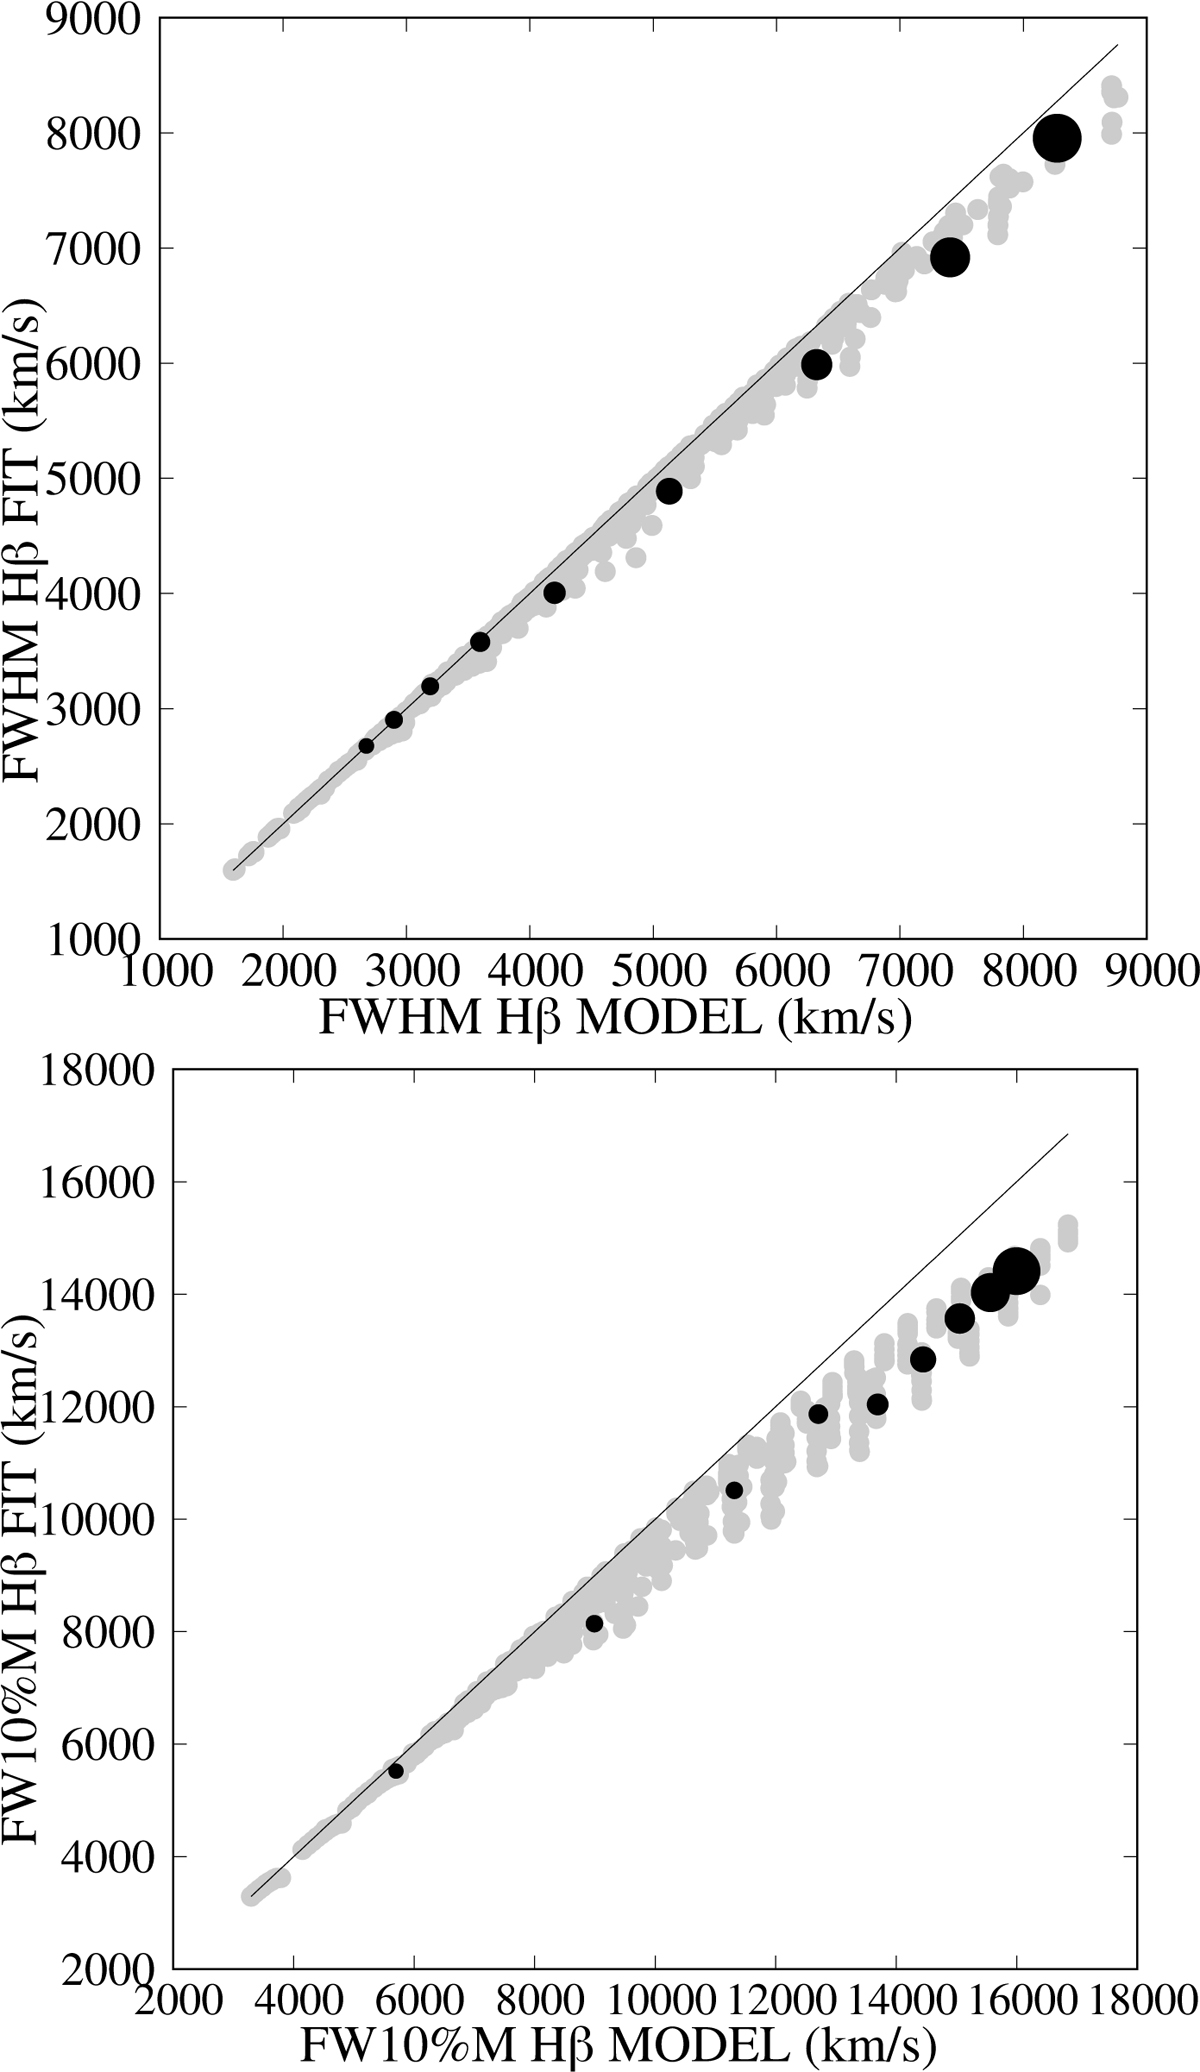
Fig. 8.
Download original image
Comparison between spectral parameters obtained from the best fit after continuum subtraction using continuum windows, with the same parameters as they are included in the model, for FWHM Hβ (top) and FW10%M Hβ (bottom). The black dots are values obtained from the initial set of model spectra, and their size increases as the VBLR contribution increases in the model spectra. The grey dots are values obtained from the large sample of model spectra. The solid line displays a one-to-one relationship.
Current usage metrics show cumulative count of Article Views (full-text article views including HTML views, PDF and ePub downloads, according to the available data) and Abstracts Views on Vision4Press platform.
Data correspond to usage on the plateform after 2015. The current usage metrics is available 48-96 hours after online publication and is updated daily on week days.
Initial download of the metrics may take a while.