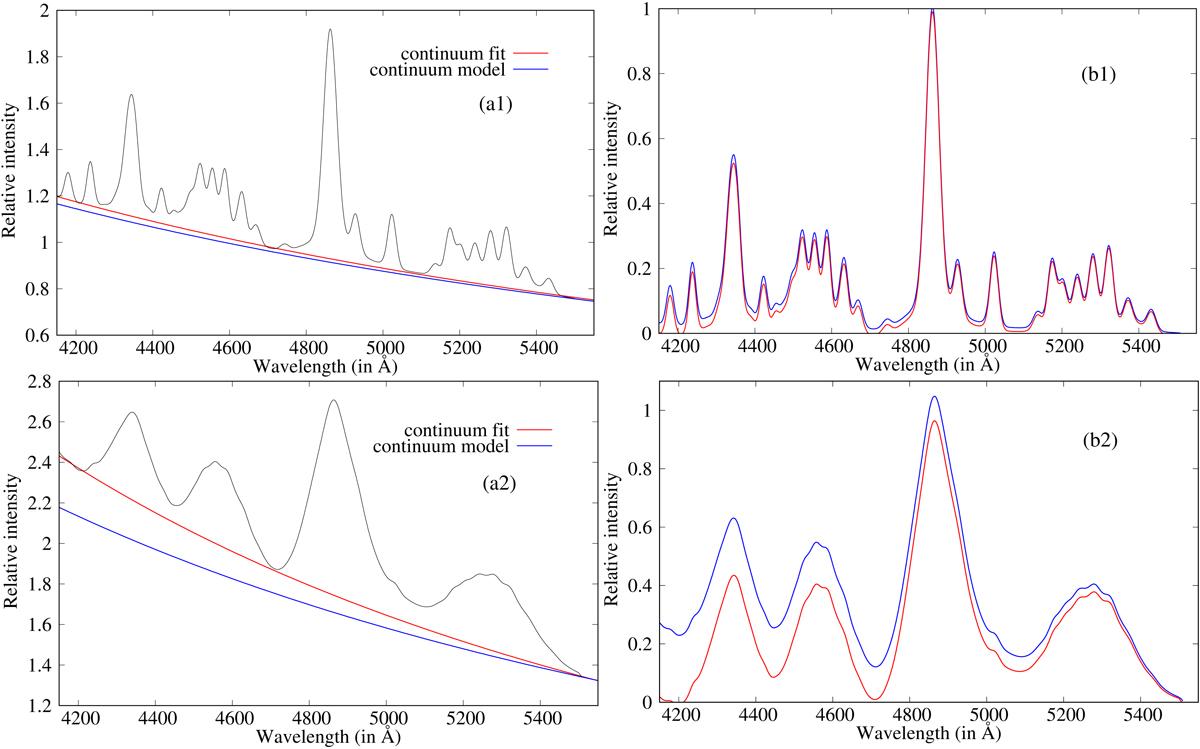
Fig. 5.
Download original image
Comparison between the estimated continuum level by the fitting procedure and the initial continuum included in models. The initial model with 0.9 ILR and 0.1 VBLR contribution is given in panels a1 and b1, and the initial model with 0.1 ILR and 0.9 VBLR contribution is given in panels a2 and b2. In panels a1 and a2, the continuum level estimated by fitting is assigned the red line, while the continuum included in the model is assigned the blue line. In panels b1 and b2, the red line represents the line flux after subtraction of the continuum determined from fit, while the blue line is the sum of the Hβ + Fe II from model.
Current usage metrics show cumulative count of Article Views (full-text article views including HTML views, PDF and ePub downloads, according to the available data) and Abstracts Views on Vision4Press platform.
Data correspond to usage on the plateform after 2015. The current usage metrics is available 48-96 hours after online publication and is updated daily on week days.
Initial download of the metrics may take a while.