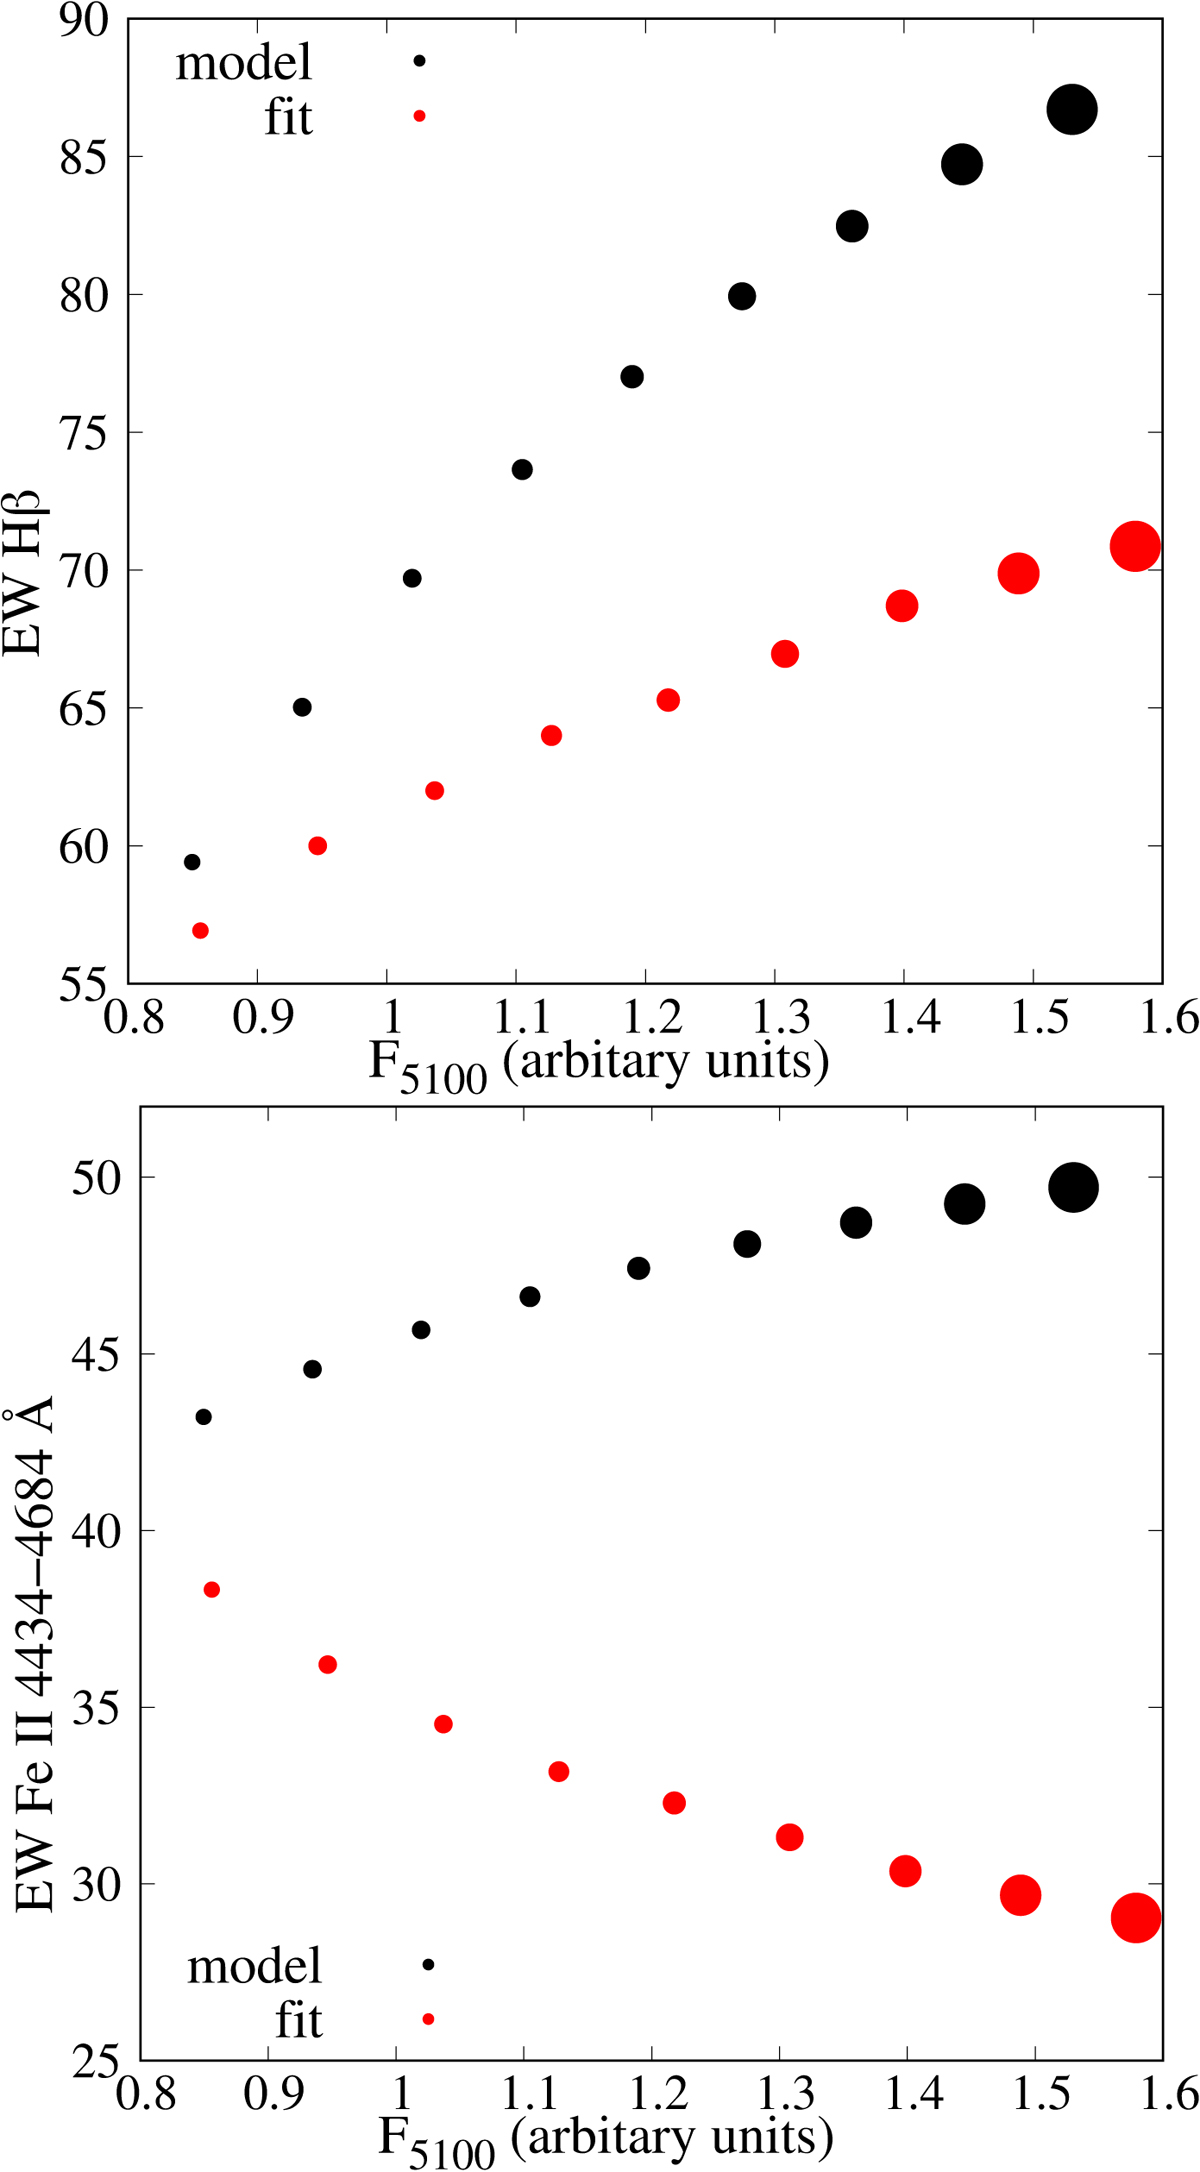
Fig. 12.
Download original image
Correlations between line EWs and continuum flux. Correlation between EW Hβ and continuum flux for parameters obtained from fit (red dots) and for parameters included in the model (black dots) for the initial set of model spectra (top). The same just for EW Fe II 4434−4684 Å and continuum flux (bottom). The size of the dots denotes the contribution of the VBLR in the model spectra, where the largest dots represent the largest VBLR contribution.
Current usage metrics show cumulative count of Article Views (full-text article views including HTML views, PDF and ePub downloads, according to the available data) and Abstracts Views on Vision4Press platform.
Data correspond to usage on the plateform after 2015. The current usage metrics is available 48-96 hours after online publication and is updated daily on week days.
Initial download of the metrics may take a while.