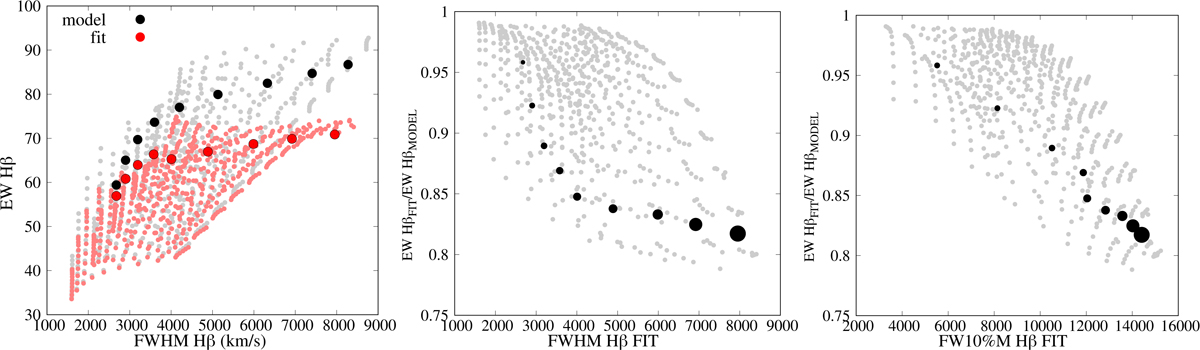
Fig. 10.
Download original image
Correlations between different spectral parameters. Left: comparison between the EW Hβ and FWHM Hβ obtained from the best fit (red dots) and from the model (black dots) for the initial set of model spectra. The same is given for a large sample of model spectra, where parameters measured after fitting are assigned with light-red, small dots, and parameters from the model with grey dots. Middle and right: black dots are values obtained from the initial set of model spectra and their size increases with a larger VBLR contribution in the model spectra. The grey dots are values obtained from the large sample of model spectra.
Current usage metrics show cumulative count of Article Views (full-text article views including HTML views, PDF and ePub downloads, according to the available data) and Abstracts Views on Vision4Press platform.
Data correspond to usage on the plateform after 2015. The current usage metrics is available 48-96 hours after online publication and is updated daily on week days.
Initial download of the metrics may take a while.