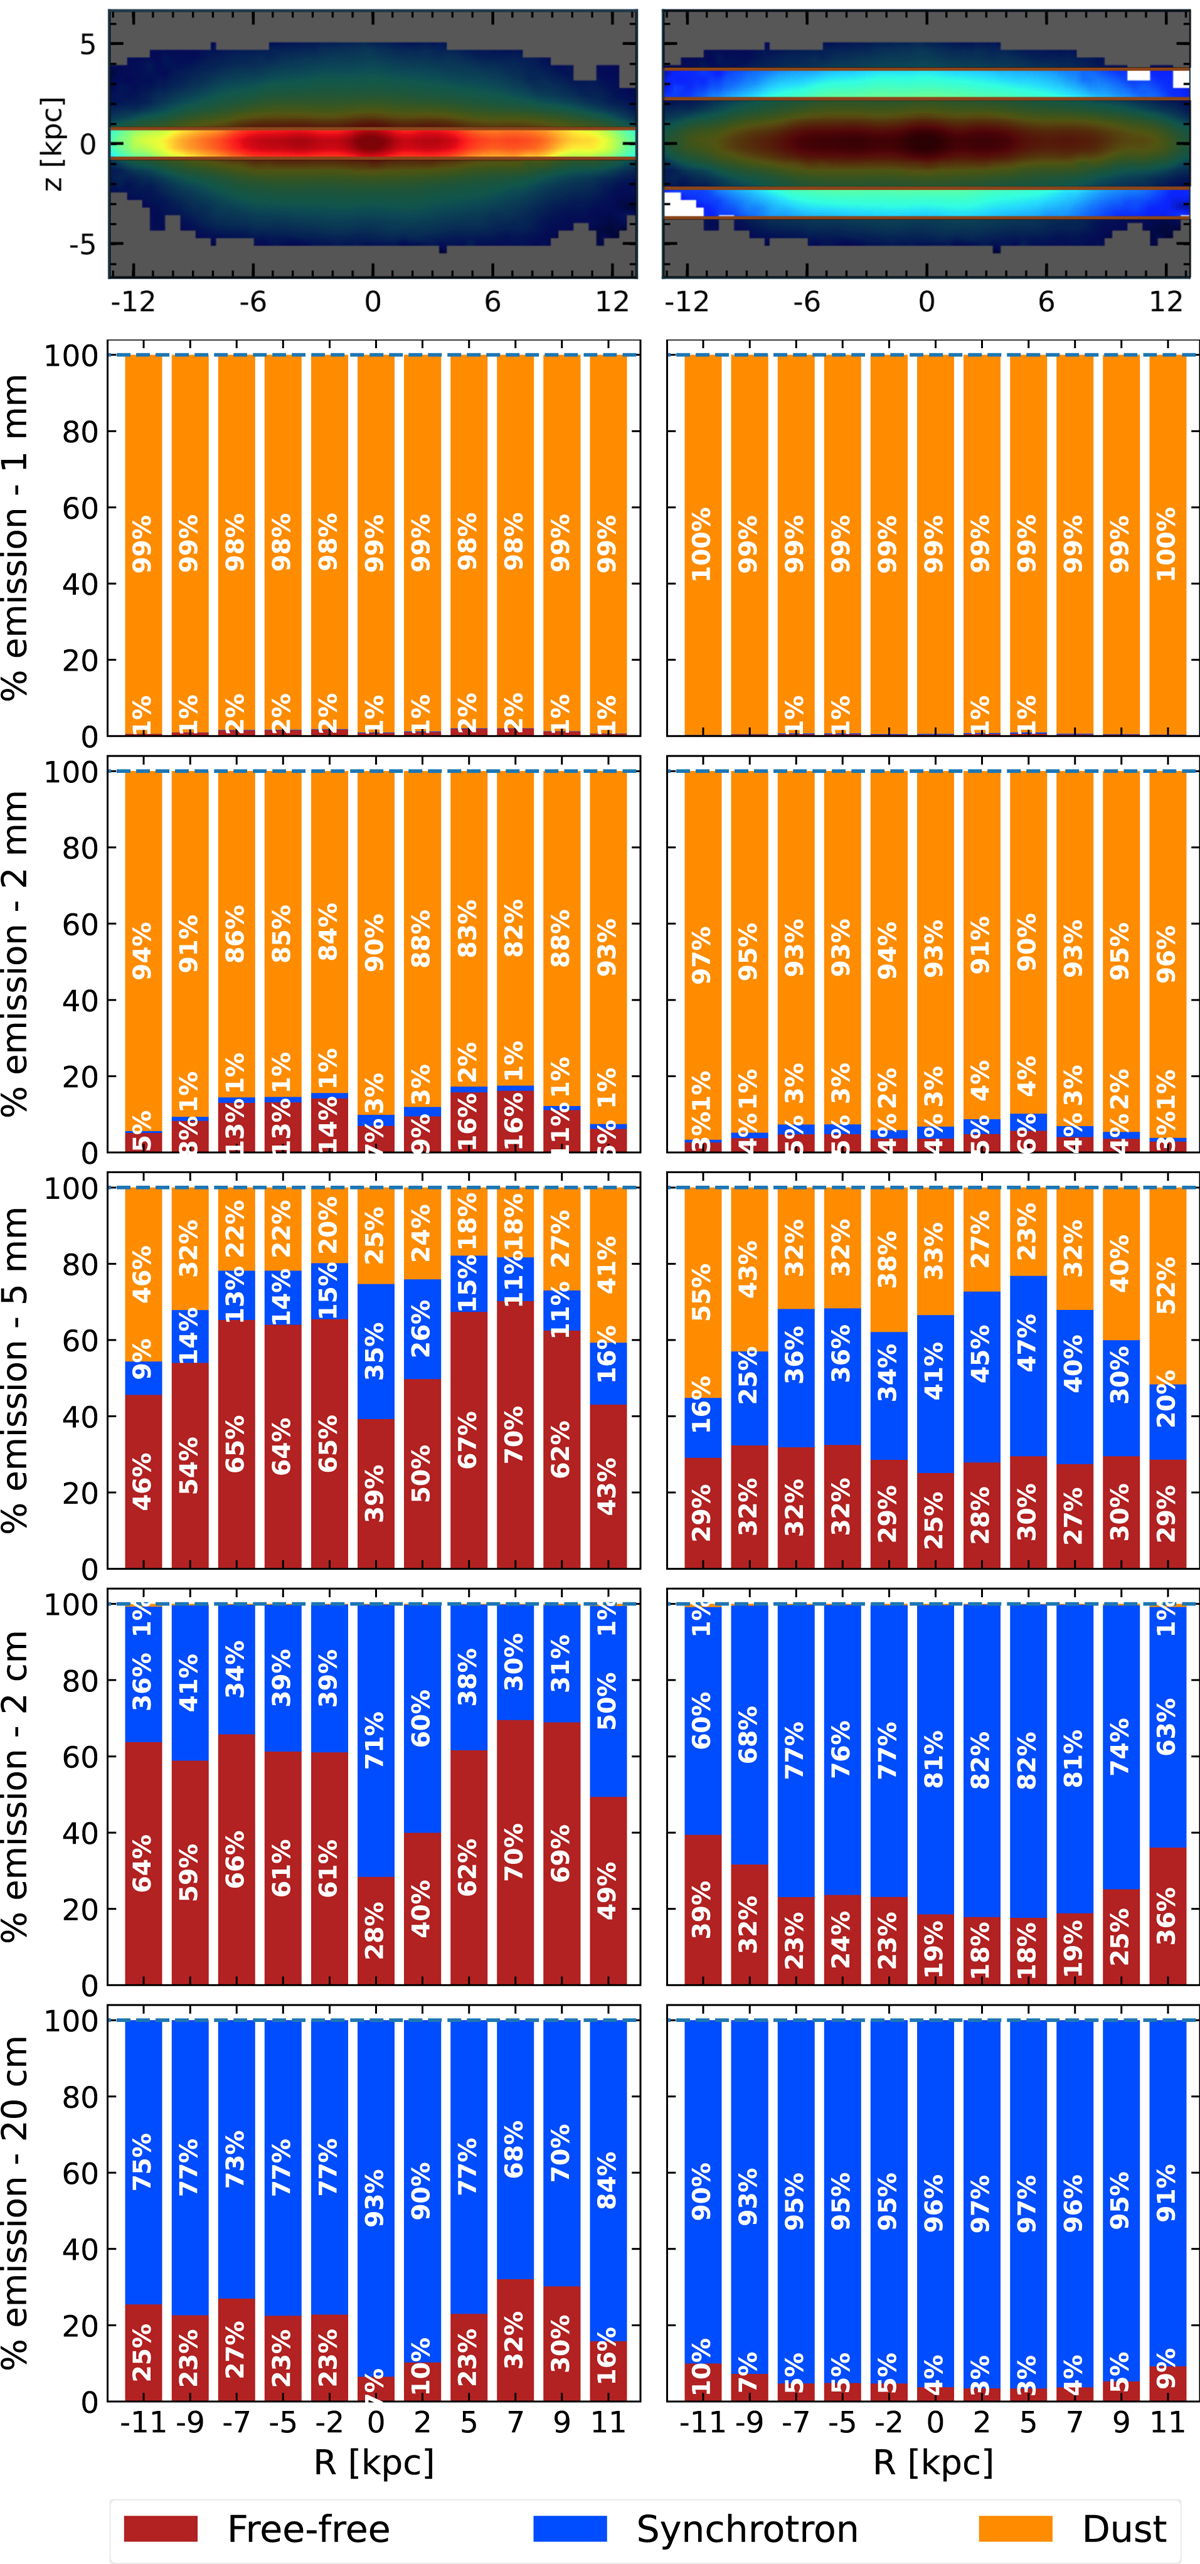
Fig. 5.
Download original image
Emission components that contribute to the total flux at 1, 2, and 5 mm, 2 and 20 cm (top to bottom panels) in the galactic plane (left panels) and in the halo (right panels). The emission percentages for the dust, free–free, and synchrotron emissions are shown as orange, red, and blue bars, respectively. The actual percentage for each emission mechanism at each position is given in numbers in the plots. The top two panels indicate the positions along the major axis of the galaxy where the decomposition was made. For the halo at |z|∼3 kpc (right panel), the mean values in the two horizontal lanes indicated in the plot were taken into account.
Current usage metrics show cumulative count of Article Views (full-text article views including HTML views, PDF and ePub downloads, according to the available data) and Abstracts Views on Vision4Press platform.
Data correspond to usage on the plateform after 2015. The current usage metrics is available 48-96 hours after online publication and is updated daily on week days.
Initial download of the metrics may take a while.