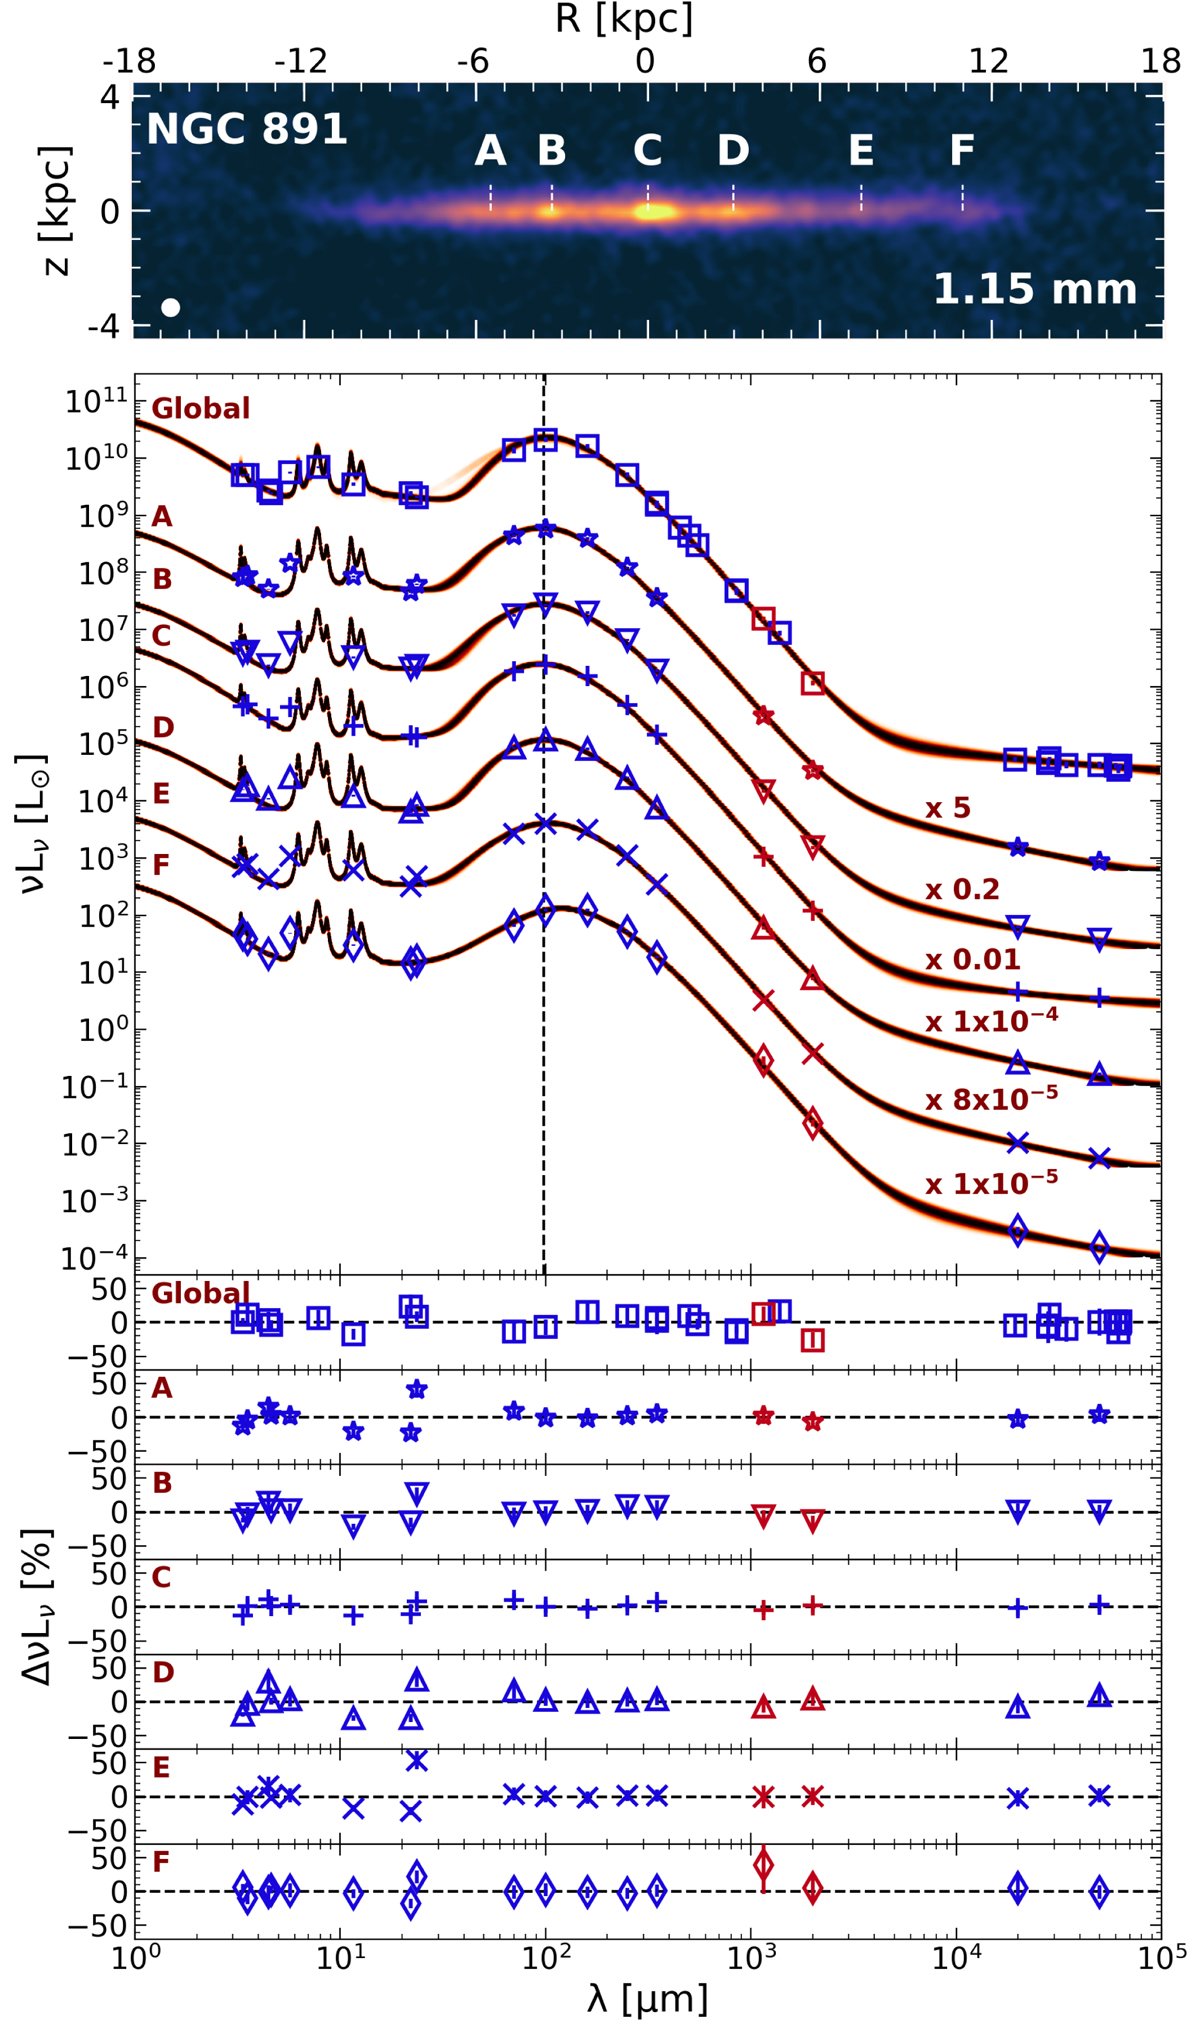
Fig. 2.
Download original image
Spectral energy distributions at different positions throughout the galaxy. The top SED shows the global SED (with HerBIE fitted to the integrated luminosities), and the remaining six SEDs are at the positions A to F that are indicated in the top panel and refer to an area of 0.37 × 0.37 kpc2 each. These positions are centered at −5.5, −3.4, 0.0, 3.0, 7.5, and 11 kpc along the major axis of the galaxy (A, B, C, D, E, and F, respectively) and represent the regions of interest discussed in various places in our analysis. The observed luminosities are indicated with the different symbols for each SED. The respective model (and its uncertainty) is presented with the continuous line. NIKA2 luminosities are indicated in red in all the SEDs. The luminosity values are correct only for the global SED, and the rest of the SEDs are scaled by the number indicated next to each model. The vertical dashed line at 98 μm, the peak wavelength of the IR SED in region A, indicates how the peaks of the rest of the SEDs are placed with respect to this SED. This is an indication of the relative dust temperature difference in the various positions throughout the galaxy.
Current usage metrics show cumulative count of Article Views (full-text article views including HTML views, PDF and ePub downloads, according to the available data) and Abstracts Views on Vision4Press platform.
Data correspond to usage on the plateform after 2015. The current usage metrics is available 48-96 hours after online publication and is updated daily on week days.
Initial download of the metrics may take a while.